How Multi-Product Brands Should Split an AI Visibility Baseline: When to Read the Brand Number, and When You Must Look by Product or Scena
Brand-level AI visibility is weighted by answer volume, so a weak product can hide inside a rising number. Learn when to look by brand, product or scenario
A rising brand-level AI visibility number does not mean every product is rising. Brand-level AI visibility is calculated by pooling the answers to every product's questions. The product with the most questions carries the most weight. A product with few questions can lose visibility, or barely be mentioned by AI at all, and the overall number won't show it. And when the number of questions per product, or the number of times each question is sampled, changes, the overall number moves on its own. To tell whether one product's gain is hiding another product's absence, use the same questions and the same period, and split the overall change into two parts: the change in each product's own visibility, and the change in each product's share of answers.
1. Why does the brand's overall AI visibility go up while some products get mentioned by AI less and less?
The direct reason: brand-level AI visibility is a weighted average. It pools the answers to every question you monitor and calculates "answers that mention the brand ÷ all answers." How much weight each product carries depends on how many questions it has in the question set and how many answers those questions collect. When a heavily weighted product rises a little, the overall number rises with it. When a lightly weighted product falls, or is never mentioned at all, the overall number barely moves.
Take Apple in a historical sample Dageno collected from three example markets: smartphones, laptops and smartwatches. Apple and Samsung appear here as public examples, not as Dageno customers. From August 3 to 19, 2026, Apple was mentioned in 53.4% of smartphone answers (12,807 answers), 43.5% of laptop answers (9,578) and 61.6% of smartwatch answers (3,301). Pooled together, that comes to 50.8%. Smartwatch answers made up only 13% of the total. So even if Apple's smartwatch visibility dropped 10 percentage points, the overall number would fall by only about 1.3 points, which is easy to dismiss as normal fluctuation in a report.
The second reason is harder to spot: when the share of answers coming from each product changes, the overall number changes too, even if no product actually got better. The number of answers depends on two things: how many questions are asked, and how many answers each question collects. Here is Samsung from the same sample. We pooled the answers from all three markets, which is the same as using one question set that mixes questions about three products, and calculated Samsung's brand-level visibility. Period 1 is August 3–10; Period 2 is August 11–19. Start with the raw counts:
Product
Period 1 answers
Period 1 answers mentioning Samsung
Period 2 answers
Period 2 answers mentioning Samsung
Smartphones
7,215
5,788
5,592
4,130
Laptops
6,066
198
3,512
162
Smartwatches
1,360
634
1,941
907
Total
14,641
6,620
11,045
5,199
The ratios come straight from these counts:
Metric
Period 1
Period 2
Change (percentage points)
Brand level (all three pooled)
45.2% (6,620 ÷ 14,641)
47.1% (5,199 ÷ 11,045)
+1.9
Visibility in smartphone answers
80.2% (5,788 ÷ 7,215)
73.9% (4,130 ÷ 5,592)
−6.4
Visibility in laptop answers
3.3% (198 ÷ 6,066)
4.6% (162 ÷ 3,512)
+1.3
Visibility in smartwatch answers
46.6% (634 ÷ 1,360)
46.7% (907 ÷ 1,941)
+0.1
Smartphone share of all answers
49.3%
50.6%
+1.3
Laptop share of all answers
41.4%
31.8%
−9.6
Smartwatch share of all answers
9.3%
17.6%
+8.3
Note: Changes are calculated from unrounded values.
Smartphones fell 6.4 points, yet the brand-level number rose 1.9 points. The last three rows explain why. In Period 2, laptop answers, where Samsung is barely mentioned, dropped from 6,066 to 3,512, and their share fell from 41.4% to 31.8%. Smartwatch answers, where Samsung does moderately well, rose from 1,360 to 1,941, and their share climbed from 9.3% to 17.6%. The overall gain came from a change in what was asked and how often, not from any product being mentioned more by AI. The laptop row says even more: Samsung sells laptops, yet only 3% to 5% of laptop answers mentioned it in either period, while the brand-level number stayed above 45% the whole time.
So did the number of laptop questions fall? No. Deduplicating by prompt ID shows how many distinct questions each product had in each period, and how many answers each question produced on average. Answers to the same question from different platforms, regions or dates all count.
Product
Period 1 questions
Period 2 questions
Period 1 answers per question
Period 2 answers per question
Smartphones
3,249
3,748
1.65
1.22
Laptops
1,885
2,049
2.25
1.41
Smartwatches
649
1,155
1.59
1.19
Note: Only answers that can be linked to a prompt ID are counted, covering 70% to 82% of answers depending on the product and period. Use this table for direction only; don't multiply it against the answer counts above.
Laptops actually had slightly more questions (1,885 to 2,049) but fewer answers, because each laptop question produced an average of 1.41 answers instead of 2.25. Smartwatch questions nearly doubled (649 to 1,155). In other words, a product's share of answers can shift because of how many questions it has, or because of how many times each question was run. That is why Section 7 asks you to fix both the question set and the sampling count.
Statisticians call it Simpson's paradox when a trend in a whole population appears, disappears or reverses once the population is split into subgroups (the Stanford Encyclopedia of Philosophy's definition). Brand-level visibility runs into the same kind of problem: when the proportions of the subgroups change, the pooled number can move in a different direction from the split numbers.
Whether a question contains the brand name also changes the overall number. In Better Metrics for AI Search Visibility, Ann Smarty of Practical Ecommerce points out that a tool's visibility score depends entirely on which questions are asked. Branded questions will likely score close to 100%, so they should sit in a separate group. If one product gains more branded questions, the brand-level number gets inflated as well.
One more thing before moving on: the 6.4-point drop for smartphones in the table needs to be split again. As Section 7 shows, most of it also came from a different set of questions being asked.
2. The brand's overall AI visibility went up — how can you tell whether it's hiding a product that's falling behind?
Short answer: for the same period and the same question set, split the answers by product and calculate two numbers for each product: its own visibility, and its share of all answers. Then compare with the previous period and split the overall change into two parts: "change within each product" and "change in the question mix." If you see any of the following, a product is being hidden:
The overall number is rising, but some product's own visibility is falling;
A product's visibility has been low for a long time, but it carries so little weight that the overall number doesn't show it;
Most of the overall gain comes from the change in the question mix, not from changes within products.
The method takes three steps:
Tag every question with the product it belongs to. Each question belongs to only one product. Questions that cover two products, and questions that contain the brand name, each go into their own separate group and are not mixed into any product.
For each product, calculate its visibility and its share of answers in both periods.
Split the overall change into the two parts below.
Effect of the change within a product: the product's average share of answers across the two periods × the change in its own visibility.
Effect of the change in the question mix: the product's average visibility across the two periods × the change in its share of answers.
Add both parts up across all products and you get exactly the overall change.
Here is the split for Samsung from Section 1:
Product
Change in own visibility
Effect on the overall number
Change in share of answers
Effect of the question mix
Smartphones
−6.4
−3.2
+1.3
+1.0
Laptops
+1.3
+0.5
−9.6
−0.4
Smartwatches
+0.1
0.0
+8.3
+3.9
Total
—
−2.7
—
+4.5
Note: All values are in percentage points; the two totals add up to +1.9 (calculated from unrounded values).
Together, the changes within the three products pulled the overall number down by 2.7 points, while the change in the question mix pushed it up by 4.5 points. Looking only at the brand level, you would think Samsung did better in AI answers during this period. Split it, and you see that smartphones were falling, laptops were almost absent, and the overall number was held up by more smartwatch answers and fewer laptop answers.
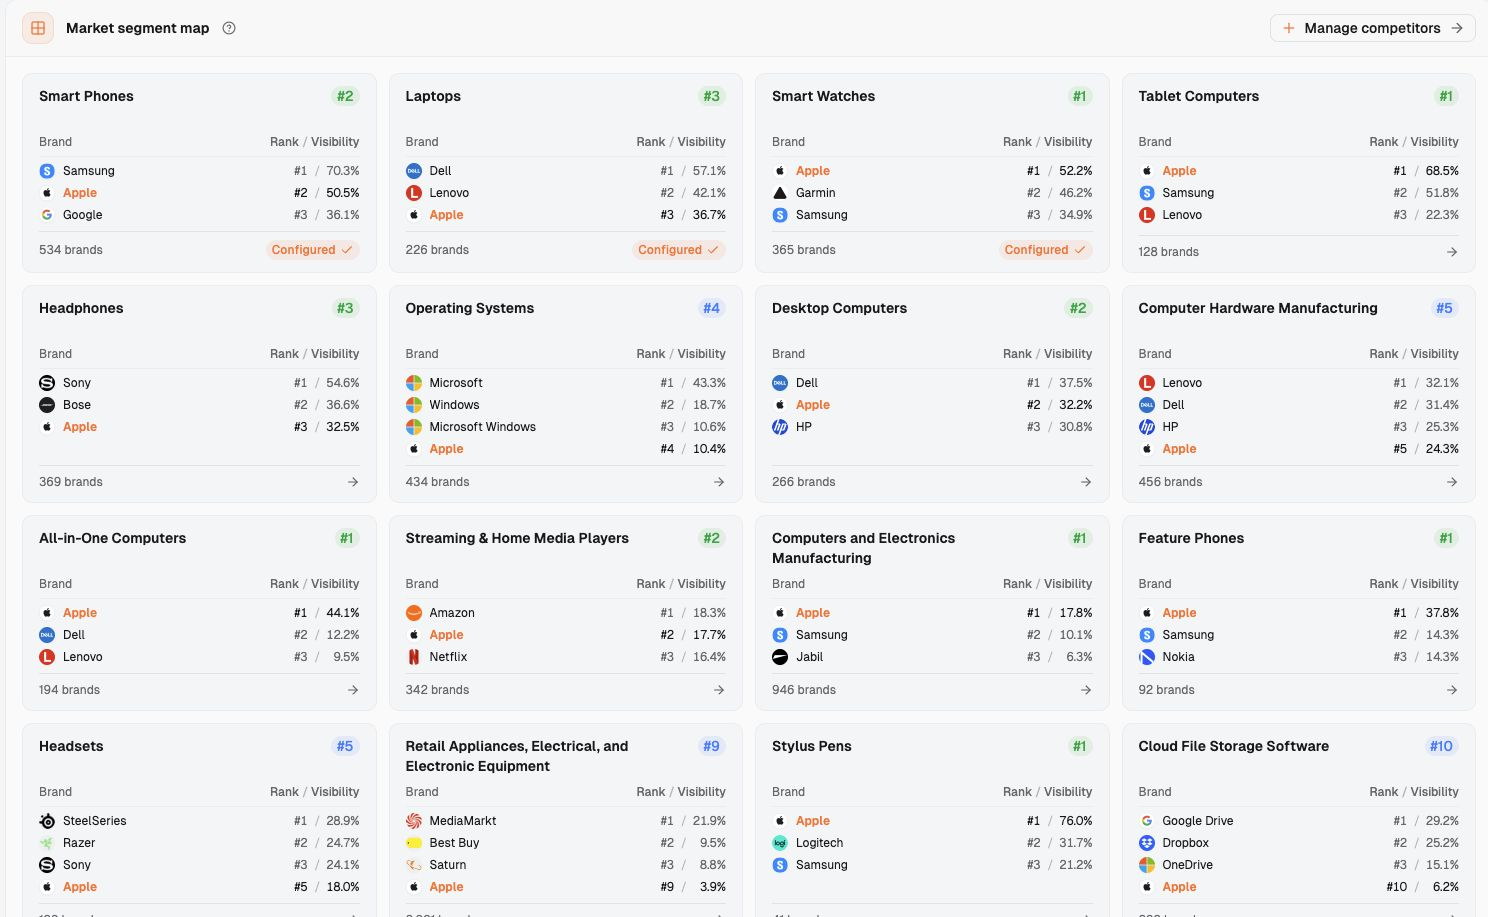
If you use Dageno, you can start step one, looking at each product separately, on the AI Market Segments page. It lists the same brand's rank and visibility in each market, along with each market's leading brands (see Figure 1). The split in step three currently has to be done in a spreadsheet after exporting the data; we did not find a feature in the product that produces this split directly.
Figure 1: The Apple workspace on Dageno's AI Market Segments page. The same brand ranks #2 in Smart Phones (50.5%), #3 in Laptops (36.7%), #1 in Smart Watches (52.2%) and only #10 in Cloud File Storage Software (6.2%), and each market has different leading brands. Apple is a public brand example, not a Dageno customer. The image doesn't show the reporting period; visibility is not sales or market share, and a low rank does not prove an opportunity worth entering.
3. After splitting the numbers, you find a product AI barely mentions — how do you confirm it isn't a fluke?
Short answer: confirm three things before you draw a conclusion.
When the same question is asked several times, the product never shows up, and competitors take its place.
Answers that name the product's model are credited to the brand, so the low number isn't a counting error.
The product is actually sold in the regions and at the price points the questions ask about.
Only when all three hold is it a real absence. A question asked once or twice, or a handful of answers, is not enough.
3.1 The same question was asked three times and the product was missing twice — does that count as absent?
No. At most, it counts as unstable. AI answers can differ every time. SparkToro and Gumshoe.ai had 600 volunteers run 12 brand-recommendation prompts through ChatGPT, Claude and Google's AI answers a total of 2,961 times between November and December 2025. The chance that the same prompt returned the same list of brands twice was under 1% (SparkToro's original post). Schulte, Bleeker and Kaufmann at the University of St. Gallen also argue that visibility should be read as a distribution across repeated measurements, not as the result of a single observation (Don't Measure Once). According to the paper, running a prompt once gives a standard error of 0.370 for a brand's detection rate; after 7 runs it falls below 0.10. One practitioner also said in a Reddit discussion that visibility on the same prompts swung 15% to 20% from one week to the next with no changes on their side. That is a personal observation, not a statistical finding.
So look at the results after repeated sampling. In the three-market sample, 26 groups of laptop questions were asked at least three times on the same platform in the same region.
Samsung: it never appeared in 23 of the groups, appeared intermittently in 3, and appeared every time in none.
Apple: in the same 26 groups, it appeared every time in 21.
The sample is small, but it is enough to show that Samsung's absence wasn't a matter of one or two unlucky samples. Its visibility was also low across every kind of laptop question:
Best for a use case: 5.5%
Best overall: 5.4%
Best for budget: 6.9%
Suitability check: 0.8%
This means the whole product is missing, not just one scenario. Brands such as Dell (63.0%), Lenovo (49.2%) and Apple (43.5%) took those spots.
3.2 The answer names the product model but not the brand — does it count as a mention of us?
It depends on the tool's detection rules, and it's best to read the original answers and spot-check. The sample contains 8,713 laptop answers with readable full text. The spot check found:
4,207 answers contained "MacBook," and 571 of them (about 14%) were not recorded as mentioning Apple.
292 answers contained "Galaxy Book," and 19 of them were not credited to Samsung.
The missing credit could come from a detection rule that counts only brands presented as recommendations, or from missed detections; check it against the tool's rules. For Samsung, even counting all of these, answers that mention Galaxy Book make up only about 3% of laptop answers, so the conclusion that the product is absent still holds.
3.3 AI doesn't mention us at a price point we don't even sell — is that still an absence?
It isn't a gap. Log it as "not pursuing." Samsung does have a Galaxy Book laptop line, but the sample covers many countries and regions. We did not check which models are sold where, or at what price; only the brand's own product team can confirm that. In the same way, if a brand has no product at a given price point or for a given use, it's normal for AI not to mention it, and it shouldn't be treated as a content gap.
In Dageno, numbers on the market segment and search intent pages can be clicked through to the underlying AI answers, showing the platform, region and full answer text (based on Dageno's product knowledge base records from September 8–9, 2026). You can do the first two checks there; the third needs your own product data.
4. Leadership wants one number while product owners want their own — when is the brand-level number enough?
Short answer: the brand-level number is enough when all three of these conditions hold:
All products face the same buyer questions and the same competitors;
The question you need to answer is about the brand, such as "how often are we mentioned in AI answers for this category overall?" or whether the brand positioning needs to change;
Each product's share of the question set stays fixed from period to period.
If any one of them fails, the brand-level number is only a trend reference; it can't tell you whether a given product is doing well.
The first condition usually holds for single-category brands. Think of a brand that only makes smartwatches: its different models face the same kind of questions and the same rivals. Splitting by model leaves too few answers in each piece and makes things harder to read, not easier. Splitting also has a cost. Using a standard statistical test, ThriveStack estimates that telling a true 10% mention rate from a true 15% one with 95% confidence takes roughly 686 runs per condition (ThriveStack's summary). Split into five products, and each one needs enough answers of its own, so the sampling volume multiplies.
The second condition is about reporting to leadership. Leadership usually needs only the overall trend and whether any product has a problem, not the detail of every scenario.
The third condition is the easiest to overlook. Samsung in Section 1 shows that when each product's share of answers changes, the overall number moves on its own. The fix is to calculate the brand-level number with fixed weights: work out each product's visibility first, then combine them using weights that are set in advance and stay the same every period. You can freeze the weights at the current question proportions, or set them by each product's business importance. Then no change in question counts or sampling frequency can move the overall number.
Even if leadership sees only one number, add a line underneath with each product's visibility and change, as a check on whether any product is slipping. Keep questions that contain the brand name in their own line and out of the overall number. Branded and unbranded questions measure two different things; see the difference between branded and unbranded mentions.
5. The brand ranks near the top overall, but one product trails its competitors — when do you have to track each product separately?
Short answer: if any of the following applies, give each product its own baseline, meaning its own questions, its own competitor list and its own starting number:
The products don't share the same competitors;
The products' visibility differs widely;
Different people own the products, with different website pages and budgets;
One product makes up so small a share of the question set that the overall number can't show its changes.
Different competitors are obvious in the three-market sample. The top five brands by visibility are entirely different in each market:
The same Apple competes with Samsung and Google in smartphone answers, but with Dell and Lenovo in laptop answers. Combine these into one brand-level ranking, and you are no longer comparing against the same rivals.
A wide gap looks like this: Samsung's visibility is 77.4% in smartphones, 46.7% in smartwatches and only 3.8% in laptops. Apple in Figure 1 is the same story: #1 in smartwatches, #3 in laptops and only #10 in cloud storage.
Different owners means that judging people on the brand-level number hands out credit or blame they didn't earn. The person who owns laptops might see a rising number simply because there were more smartwatch questions, while their product didn't change at all.
A small share means that, by the math in Section 1, the product can drop 10 points while the overall number moves just over 1.
Outside research and practitioners point to the same thing. The vendor Odyssiant analyzed 5,356 AI answers from February to April 2026 and concluded that brand visibility tells you whether AI recognizes the company, while product visibility tells you whether the right offer is understood in the right buying context. The difference matters most for companies with many product or service lines (Product Visibility vs Brand Visibility). The study adjusted its scoring method during this period, and the authors note that the patterns by buying stage should be read as an emerging baseline, not a clean trend. A practitioner on Reddit also described brands getting "split into two profiles" in AI, one for product queries and one for company information (the original discussion). That is a personal observation, but it makes the same point: being recognized as a brand is not the same as having your product recommended.
Tracking each product separately is not complicated:
List each product's own buyer questions, without the brand name;
Give each product its own competitor list;
Record each product's starting visibility;
Build the brand-level number from the product numbers, using the fixed weights from Section 4.
Dageno's Product Portfolio Planning solution page describes exactly this kind of comparison: compare AI visibility and rank across product lines first, then pick one line and dig into buyer questions and selling points. The page also states its limits: AI-answer position and coverage do not measure market demand, market share or revenue, and results from different markets should be kept separate.
6. A product gets recommended in "which one is best" questions but disappears once buyers ask about budget picks — when do you have to look by scenario?
Short answer: when the same product's visibility or rank differs widely across types of buyer questions, and you need that gap to decide which page to change or what content to add, split one level further by scenario. If the gap comes from a price point or use you don't serve, just note it; it isn't a gap.
In the three-market sample, Apple's overall visibility in smartphone answers is 53.4%, but split by type of buyer question, the picture changes a lot:
Type of buyer question
Visibility
Answers
Best overall
73.8%
839
Best for budget
22.9%
376
Why choose it
18.5%
287
Question types are Dageno's classification. For the scenario split we used only answers that could be linked to question metadata, about 78% of smartphone answers.
Looking only at the product-level 53.4%, you'd think the product does well in AI answers overall. Split by scenario, you see that "best overall" questions prop up the average, while the product rarely shows up once budget comes into the question.
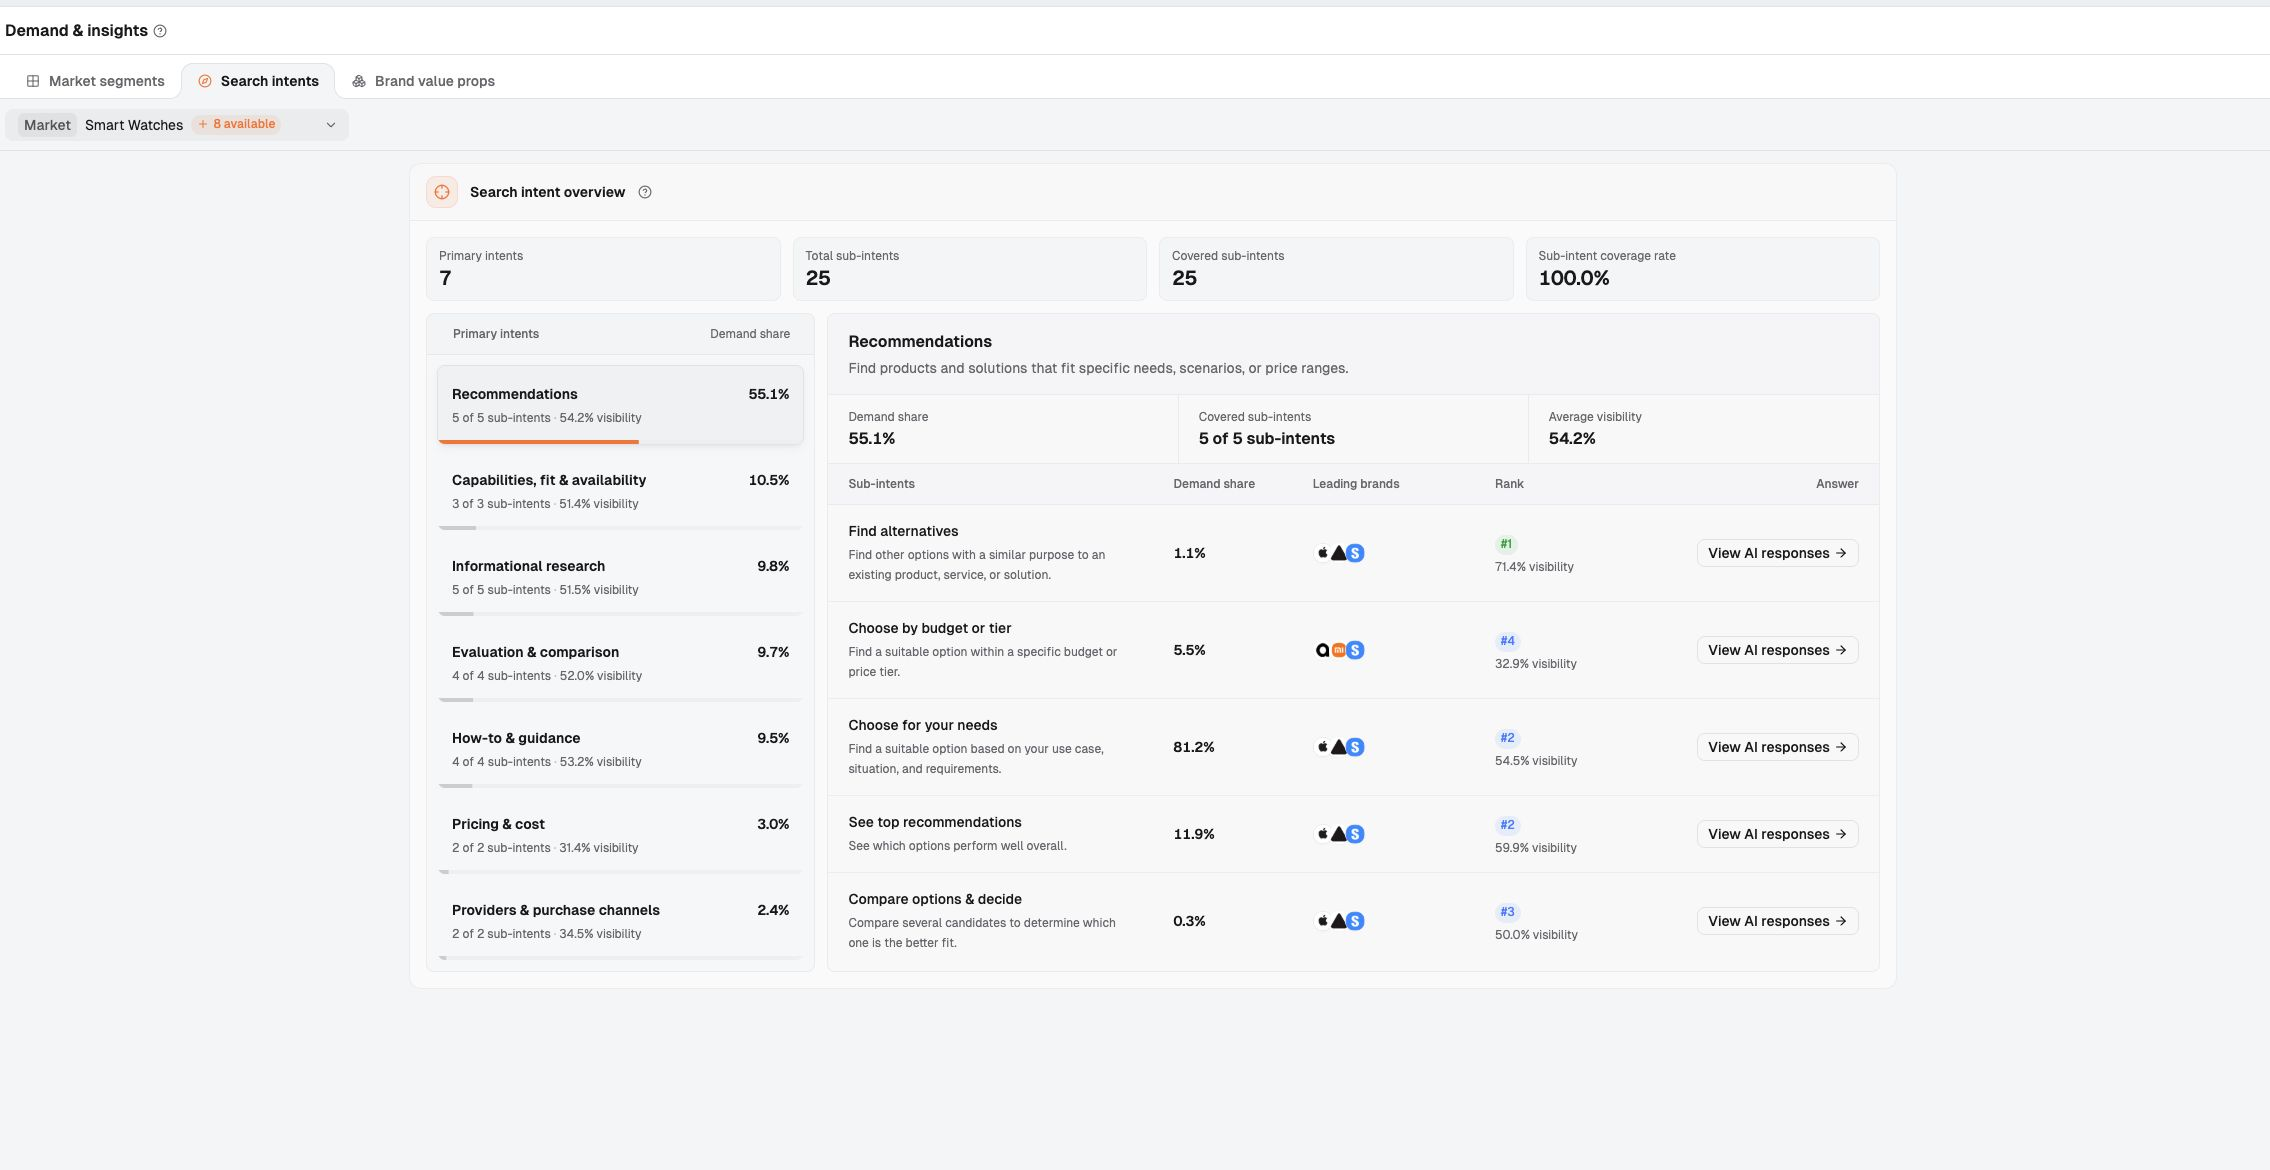
Dageno's AI Search Intents page is organized around this idea (see Figure 2). In the Smart Watches example, Apple covers all 25 sub-intents, a 100% coverage rate. But under Recommendations:
Find alternatives: #1, 71.4% visibility
See top recommendations: #2, 59.9% visibility
Choose by budget or tier: #4, 32.9% visibility
100% coverage only means the brand appears in every kind of question, not that it leads in every kind.
Figure 2: The search intents view for the Smart Watches market in the Apple workspace: 7 primary intents and 25 sub-intents, with a 100% sub-intent coverage rate. Under Recommendations, Apple ranks #1 for "Find alternatives" (71.4%) and #4 for "Choose by budget or tier" (32.9%). Demand share describes how the analyzed questions are distributed, not total search volume or proven buyer demand; the image doesn't show the reporting period.
In Prompt-Level Visibility, Swetha Venkiteswaran of Pixis gives an example: two brands with the same overall visibility score. One shows up consistently across all kinds of questions; the other is strong on broad questions but disappears when buyers ask about alternatives or specific use cases. Their averages are identical, but their commercial positions are completely different. The overall score tells you where to look; the individual questions tell you why.
It's also worth saying when not to split by scenario. If a scenario has only a few dozen answers, its ups and downs are mostly random; watch it together with the rest until there is enough data to split. And if the brand has no product for that price point or use, there's no need to set a separate baseline for that scenario.
The table below sums up when each view fits:
View
When to use it
What it can't tell you
Brand level
Products face the same questions and competitors; the decision is about the brand; each product's share or weight is fixed
Whether a given product is doing well; whether a page change worked
By product
Different competitors, wide visibility gaps, different owners and website pages, or a product with a small share
Which kind of buyer question is the problem within one product
By scenario
One product differs widely across buyer questions, and you need the gap to decide which page to change
Ups and downs in scenarios with too few answers; price points or uses the brand doesn't serve
7. You updated a product's website pages and the brand number rose the next month — how do you confirm that product actually improved?
Short answer: use only the questions asked in both periods, on the same platforms and regions with the same sampling count, and check whether the product's own visibility went up. Then split the brand-level change into the change within each product and the change in the question mix. You can say the product improved only if it rose on the same questions. Whether the page change caused it is a separate question you can't settle yet.
Back to Samsung in Section 1: counting all answers, its smartphone visibility fell 6.4 points. Compare only the questions asked in both periods (matched by prompt ID, 1,431 questions), and the result is completely different:
Visibility in smartphone answers
All answers
Same questions asked in both periods
Samsung
81.1% → 77.6%
84.3% → 84.9%
Apple
56.3% → 48.6%
58.2% → 55.1%
Only answers that can be linked to a prompt ID are used here, about 78% of smartphone answers, so the "All answers" column differs slightly from the numbers in Section 1.
Samsung's smartphone "decline" came almost entirely from a different set of questions; on the same questions, its visibility barely changed. Apple fell 7.7 points overall, but only about 3 points on the same questions. The platform mix of smartphone answers also shifted over the same time: Gemini's share of answers fell from 46% to 27%, while ChatGPT's rose from 30% to 48%. Use the all-answers numbers to judge any change made between the two periods, and you will reach the wrong conclusion.
So a re-check needs four things:
Freeze the question set. Record which product each question belongs to and whether it contains the brand name. You can add new questions, but compare periods only on questions that appear in both.
Keep everything else the same. Platforms, regions, language, sampling count per question and window length all stay fixed. This article doesn't cover splitting by platform or region, but if those conditions change, the periods can't be compared.
Report two things separately. First, the product's change on the same questions; second, how much of the brand-level change came from the question mix.
Log the change. When it was made, which page was changed, and what exactly changed.
In Dageno, the prompts, platforms, regions and competitors you want to re-check over time can be fixed in the monitoring settings. Importing a CSV requires four columns: prompt, platforms, regions and language. None of them is a product label, so your team needs to record which product each question belongs to in its own spreadsheet. According to Dageno's knowledge base records, only the settings screen and its input rules have been verified; submitting an import, saving it and the actual sampling have not been tested. For continuous monitoring, see Track brand visibility across AI answers.
7.1 The re-check is done — which conclusions go in the monthly report, and which get logged as "not yet proven"?
Two kinds of conclusions can go in the monthly report:
On the same questions, platforms and regions, how much the share of answers mentioning the product changed;
How much of the brand-level change came from changes within products, and how much from the question mix.
Keep a separate "not yet proven" column with at least three items:
Whether the gain came from the page change. Competitors, third-party sources and the models themselves may all have changed in the meantime.
Whether a result from a single period will last.
Whether higher visibility will bring more inquiries or sales.
Here is an example record. The brand, dates and numbers are made up and only show how to fill it in:
Item
Hypothetical example (made-up numbers)
Change
September 10: updated the laptop product page with use cases, battery test conditions and a comparison with similarly priced models
Comparison scope
The 120 laptop questions asked in both periods; ChatGPT and Google AI Mode; United States and Germany; 5 runs per question per period; 14 days per period
Change within the product
Laptop visibility on these 120 questions: 8.0% → 12.5%
Change in the brand-level number
+1.6 points: +0.9 from the laptop itself, +0.7 from more smartwatch questions
Goes in the monthly report
On the same questions, the share of answers mentioning the laptop rose 4.5 points
Not yet proven
That the page change caused the rise; whether it lasts into the next period; whether it brings inquiries or sales
8. Now that you know the brand number can hide individual products, what follow-up questions will your team ask?
8.1 Once you decide to split by product, is finer always better?
No. The finer you split, the fewer answers each piece has, and the more the numbers jump around at random. As noted above, telling a true 10% mention rate from a true 15% one takes about 686 runs per condition. Start by splitting into products along competitor and ownership lines, and break products down further into models or scenarios only once you have enough data.
8.2 You're grouping questions by product and one question covers two products — which product does it belong to?
Put it in a separate "cross-product questions" group, for questions like "how should I pair a phone with a smartwatch?" It doesn't count toward any single product; track its trend on its own. Otherwise the same answer gets counted twice, or is assigned to a product arbitrarily.
8.3 Branded questions slipped into the question set — should they count toward the brand number?
Count them separately. Questions that contain the brand name almost always mention the brand, so mixing them in inflates the overall number, and every change in how many there are moves it. For how to combine brand names, product names and category terms in a question set, see how to build an AI visibility prompt set.
8.4 With each product's number calculated, should the brand number pool all answers or use fixed weights?
Use fixed weights. Pooling the answers directly makes the result depend on shifts in each product's share of answers, as the Samsung example shows. You can freeze the weights at current question proportions or set them by each product's business importance. Once set, keep them the same every period, so that changes in the overall number reflect only changes within the products.
8.5 If AI answers name the model but not the brand, will the brand number be understated?
It can be. In the sample, about 14% of laptop answers that mentioned "MacBook" were not recorded as mentioning Apple. Spot-check the original answers using the method in Section 3, then check the tool's detection rules to decide whether those answers should count.
8.6 A product's AI visibility went up and your boss asks whether it's selling better — what do you say?
You can't claim that. Visibility is the share of AI answers that mention the product; it doesn't measure sales, market share or real search volume. To judge the business impact, compare against inquiry, traffic and sales data separately.
9. You have to report AI visibility next week — which number should you break down first?
Start with this period's and last period's brand-level visibility, using the method from Section 2:
Split both periods' answers by product, and calculate two numbers for each product: visibility and share of answers.
Split the overall change into the change within each product and the change in the question mix.
Look for three signals: a product whose own visibility is falling; a product that has been low for a long time but carries little weight; and an overall gain that comes mainly from the question mix.
If even one signal appears, add a line under the brand-level number in your report with each product's figures, and flag the product being hidden. Then decide two things: whether it needs its own baseline (Section 5), and whether to split it further by scenario (Section 6).
The brand-level number can still show leadership the overall trend. It just shouldn't be the only basis for judging whether a product is doing well.
ThriveStack: AI visibility tracking and non-determinism, published May 4, 2026 and updated September 28, 2026 (per page metadata); accessed October 19, 2026. The 686-run figure is the article's estimate at 95% confidence and 80% power, not a measured result; the author has a commercial interest.
Odyssiant: Product Visibility vs Brand Visibility in AI Search, published May 9, 2026 (per page metadata); accessed October 19, 2026. Vendor research covering 5,356 answers from February to April 2026; the scoring method was adjusted during the study period.
Dageno is the research and insights team at Dageno AI, publishing industry reports and expert analysis on AI Search Visibility, Generative Engine Optimization (GEO), and AI-powered search discovery.