Does One AI Recommendation Count as Improvement? How to Set Sample Size and Retest Frequency Before It Goes in a Report
A team sees one AI recommendation and wants to put it in a report. See how results change between rounds, then use your own baseline to set sample size, retest frequency, and a reporting threshold.
Explore 12,000+ niche markets with no login required
Updated by
AI-assisted for research support
11 Min Read•
Updated on Oct 09, 2026
TL;DR
No. One recommendation in one response is a clue. In the August 2026 collection records across three markets, about 9% of the prompts whose first-round response did not mention Apple got a response that mentioned it when asked again a few days later; these records had no corresponding known page changes. Before putting a result in a report, fix the prompts and keep them unchanged. Ask the same prompts over several more rounds and save each round's fresh responses. The change must be larger than the fluctuation seen without known changes, and stay above that level for several consecutive rounds. You learn how large that fluctuation is by first asking the same prompts over a few rounds; this article calls those rounds the “baseline.”
If there is only one new recommendation, a rise in one round remains within baseline fluctuation, or comparable records are still incomplete, write “Pending retest.”
If two or more consecutive subsequent rounds change in the same direction relative to the same baseline, and each exceeds the agreed threshold, write “Change observed,” with the scope and size of the change.
If the agreed observation is complete but no change has persistently exceeded the threshold, write “No sustained change within this scope and threshold.”
Once the prompt set is defined using the method for brand and category prompts, the next deliverables are a reporting threshold and an observation note attached to every conclusion. A “proportion” here means how many responses contain the brand name. For example, in Section 1.2, the first round in the smart watch market had 380 responses, of which 245 mentioned Apple: 64.47%. Appearing does not mean being recommended. Read what the response says to decide whether it is a recommendation, then record it separately using the distinction between mentions, recommendations, and citations.
1. Why One Recommendation Falls Short: Results Also Change Without Known Changes
1.1 You Update a Page, Ask Again, and the Brand Appears
Suppose the team has just added information to a product page. It asks AI again, and the brand enters the recommendation list. The content lead saves a screenshot and prepares a weekly report: “The update worked. AI has started recommending us.”
As the analysis lead, put this clue back into the full prompt set. Did other prompts change too? Did responses that previously included the brand stop mentioning it? Will this direction hold in the next collection round?
From August 3 to 19, 2026, Dageno collected AI responses in the smart watch, smartphone, and laptop markets. Some prompts were asked twice: the same prompt, on the same platform, in the same region, repeated word for word a few days later.
For example, a prompt asked on one platform in one region on August 4, then asked again on the same platform in the same region on August 10, yields two responses, one earlier and one later. This article calls such a pair a “combination.” The earlier ask is the first round; the later ask is the second round.
These records had no corresponding page changes known to us. That makes them useful for one question: without known changes, how much does the response change when the same prompt is asked again?
Market (August 3 to 19, 2026)
Combinations asked twice
Distinct prompts involved
Smart watch
380
302
Smartphone
1,658
1,397
Laptop
1,411
924
There are more combinations than prompts because the same prompt may have been asked twice on several platforms or in several regions. The two asks were 4 to 16 days apart, and about two-thirds were 5 to 7 days apart. All first rounds took place from August 3 to 6 and all second rounds from August 10 to 19, with specific dates varying by combination. The combinations cover 4 to 5 platforms and 22 to 29 regions.
1.2 Absent the First Time, Present the Next
Take Apple as an example:
In the smart watch market, 135 combinations did not mention Apple in the first round. Of these, 12 mentioned it in the second round: 8.9%.
In the smartphone market, 699 did not mention it in the first round. Of these, 64 mentioned it in the second round: 9.2%.
In the laptop market, 795 did not mention it in the first round. Of these, 76 mentioned it in the second round: 9.6%.
In other words, roughly 1 in every 11 combinations that did not mention Apple in the first round mentioned it in the next. This count covers only the brand name Apple, excluding separately recorded names such as Apple Watch and Apple Pay.
Changes also occur in the opposite direction. Look at them alongside the overall proportions for the same combinations to see what happened.
Market (August 3 to 19, 2026)
Combinations mentioning Apple in the first round
Of these, absent in the second round
Proportion changing in the reverse direction
Overall appearance in the first round
Overall appearance in the second round
Smart watch
245
24
9.8%
245/380 (64.47%)
233/380 (61.32%)
Smartphone
959
65
6.8%
959/1,658 (57.84%)
958/1,658 (57.78%)
Laptop
616
77
12.5%
616/1,411 (43.66%)
615/1,411 (43.59%)
In the smartphone market, 129 combinations changed outcome, yet the total fell by only 1, a difference of less than 0.1 percentage points. In the laptop market, 153 changed outcome, while the total also fell by only 1, a difference of less than 0.1 percentage points. Selecting only responses in which Apple newly appeared would leave the reverse changes out of the report.
The overall proportion in the smart watch market fell by about 3.2 percentage points (12 combinations), also with no corresponding known changes. If you are this brand, claiming worse performance from this decline has as little support as claiming improvement from a single rise.
For another brand, the proportion that went from absent in the first round to present in the second differs: 4.2% for Google in the smart watch market and 22.0% for Dell in the laptop market. You cannot directly use Apple's 9% as your threshold; set the threshold using your own baseline.
1.3 Turn One Clue Into Several Rounds Across a Prompt Set
SparkToro's research on consistency in AI recommendations also found that repeating the same prompt produces different recommendation lists, making repeated, aggregated observations more useful.
That new recommendation is still worth saving. It helps the team examine the reasons for the recommendation, product requirements, and cited sources. The analysis lead should keep collecting responses for the original prompt set, retaining records of new appearances, continued absences, and brands that appeared before but disappeared later.
A single response helps identify a clue. A report needs results from several rounds across a prompt set.
2. What Prompt Count, Retest Rounds, Platforms, and Regions Each Decide
2.1 Four Settings Answer Four Reporting Questions
Deciding how much to test and how long to wait after seeing the results can make the observation plan follow good news. Define these four settings first so the team has a consistent basis for reporting.
Setting
What it determines
What happens when it is too small
Who decides
Prompt count
How much the overall proportion within the same scope can fluctuate on its own
One or two changed outcomes account for a large share; important needs may also be missed
The analysis lead organizes it; the business lead confirms the scope of needs
Retest rounds and interval
Whether a one-time fluctuation can be distinguished from sustained change
Too few rounds leave a one-time fluctuation and sustained change hard to distinguish
The analysis lead proposes a plan; the client confirms the reporting cycle and observation schedule
Platforms
Which AI platforms the conclusion applies to
Coverage is limited to tested platforms; important business channels may be missed
The client or marketing lead confirms business importance
Regions
Which markets the conclusion applies to
Coverage is limited to tested regions; other markets where the product is sold need separate observation
Product and regional business leads confirm
Platforms and regions determine where a conclusion applies. Prompt count and rounds determine whether that conclusion holds up. A “group” in this article means the prompts on one platform in one region, for example 50 prompts on one platform in one region. Record each group separately and judge each against its own threshold.
2.2 Four Decisions the Client Must Confirm
The client needs to confirm where the product is sold, which platforms matter to the business, how often reports are issued, and who has authority to approve a conclusion for the report. The analysis lead then records each group's prompt count, planned dates, and record storage location.
Observe platform differences and regional differences separately, and write conclusions within each scope. In the Apple records above, no platform was more stable across all three markets: on Gemini, combinations that changed outcome accounted for 12.7% in the smart watch market and 5.8% in the smartphone market; on ChatGPT, the proportions in these two markets were 5.8% and 10.1%, respectively. Each platform needs its own baseline.
The client confirms the business scope. The analysis lead turns that scope into a repeatable observation plan. The person approving the report should also be identified: who decides whether to postpone reporting or mark a result Pending retest when records are missing, prompts change, or rounds remain incomplete?
2.3 Define One Prompt and One Round First
Asking the same prompt on 3 platforms in 2 regions gives 1 prompt and 6 combinations. Count prompts by their distinct wording. Count combinations by prompt, platform, and region. For each reporting group, save the prompt count, combination count, and actual response count. When calculating a platform's proportion, divide only by that platform's prompt count.
A round means asking the same prompt set again within an agreed period and collecting fresh responses. For example, under the arrangement in Section 1.1, a prompt asked on August 4 and repeated word for word on August 10 produces a fresh response for a new round. Reopening an old record is another look at the same round. Record each round's start and end dates and save the full responses.
For example, if all 50 prompts had responses in the previous round but only 45 came back this time, collect responses for the missing 5 first. If you temporarily compare only these 45, state in the report that the comparison covers 45 prompts. Once all 50 agreed prompts have responses, judge whether the complete prompt set has changed.
3. How to Set Prompt Count: Smaller Sets Produce Larger Fluctuations
3.1 See How Much Two Rounds Can Differ at Your Sample Size
Randomly selecting some combinations from Section 1 and comparing Apple's appearance across the two rounds in the same selected combinations shows how sample size affects fluctuation. The table uses percentage points. Negative values mean the second round was lower; positive values mean it was higher.
Combinations in each random selection
Smart watch
Smartphone
Laptop
10
−20.0 to +10.0
−20.0 to +20.0
−20.0 to +20.0
20
−15.0 to +10.0
−10.0 to +10.0
−15.0 to +15.0
50
−12.0 to +4.0
−8.0 to +8.0
−8.0 to +8.0
100
−8.0 to +2.0
−5.0 to +5.0
−6.0 to +6.0
200
−6.0 to 0.0
−3.5 to +3.5
−4.5 to +4.0
First randomly pick 10 of these combinations, with no repeats among the 10. Count how many more or fewer of them mention Apple in the second round than in the first, then express the difference in percentage points. Repeat this selection 100,000 times. The table shows the range containing at least 95% of the results. Repeat the selection 100,000 times for each of the other sample sizes in the table too. For a single platform and a single region, combination count equals prompt count.
When selecting 10 combinations, the two rounds had exactly the same overall proportion in 45.5%, 51.6%, and 42.9% of cases, respectively. Roughly half showed no difference. If 1 more or 1 fewer of the 10 mentions the brand, that is a difference of 10 percentage points.
For example, if you have only 20 prompts on one platform in one region, these three markets' records show that two rounds can differ by 10 to 15 percentage points without known changes. Small samples can produce large jumps in reports, or upward and downward changes can happen to cancel out. Use the table to understand the scale of fluctuation at your sample size, then build a baseline with your own prompt set. The ranges describe observations within these three markets and these dates.
3.2 Keep the Response Count for Each Day
Now look at daily results in the smart watch market. The table counts responses that mentioned at least one brand that day. It lists the four days with the fewest responses and the three with the most, ordered from fewest to most.
Collection date (2026)
Responses
Responses mentioning Apple
Proportion
August 16
25
13
52.00%
August 15
71
46
64.79%
August 17
99
63
63.64%
August 14
108
82
75.93%
August 4
347
229
65.99%
August 10
541
321
59.33%
August 19
832
491
59.01%
Across 13 collection days, the lowest proportion was 52.00% and the highest was 75.93%. Both extremes occurred on days with fewer responses. With only 25 responses, 1 accounts for 4 percentage points.
The prompts asked each day were different; this table illustrates only the effect of denominator size. To compare changes over time, return to combinations with fixed prompts, platforms, and regions. When a daily proportion appears to jump sharply, save that day's response count and prompt scope before deciding whether the trend belongs in a report.
3.3 Set Prompt Count by Business Scope and Reportable Change by Baseline
Start with business scope when setting prompt count. Confirm that the core prompts cover the target purchase needs, then list separate groups by platform, region, and whether the brand is named. Check each group's count individually: a large overall prompt set may still leave only a few prompts in one group.
For example, suppose you want to report a 5-percentage-point change, and this group has only 20 prompts. According to the table in Section 3.1, with 20 combinations two rounds can already differ by 10 to 15 percentage points, so a 5-point change is too small to tell apart from that. You have three options: add prompts that buyers really ask; ask more rounds; or report only the groups with more prompts, and state which groups the report covers. Adding unrelated prompts just to raise the count makes the proportion stop reflecting the original purchase needs.
3.4 Read Dashboard Trends With Daily Values and Response Counts Together
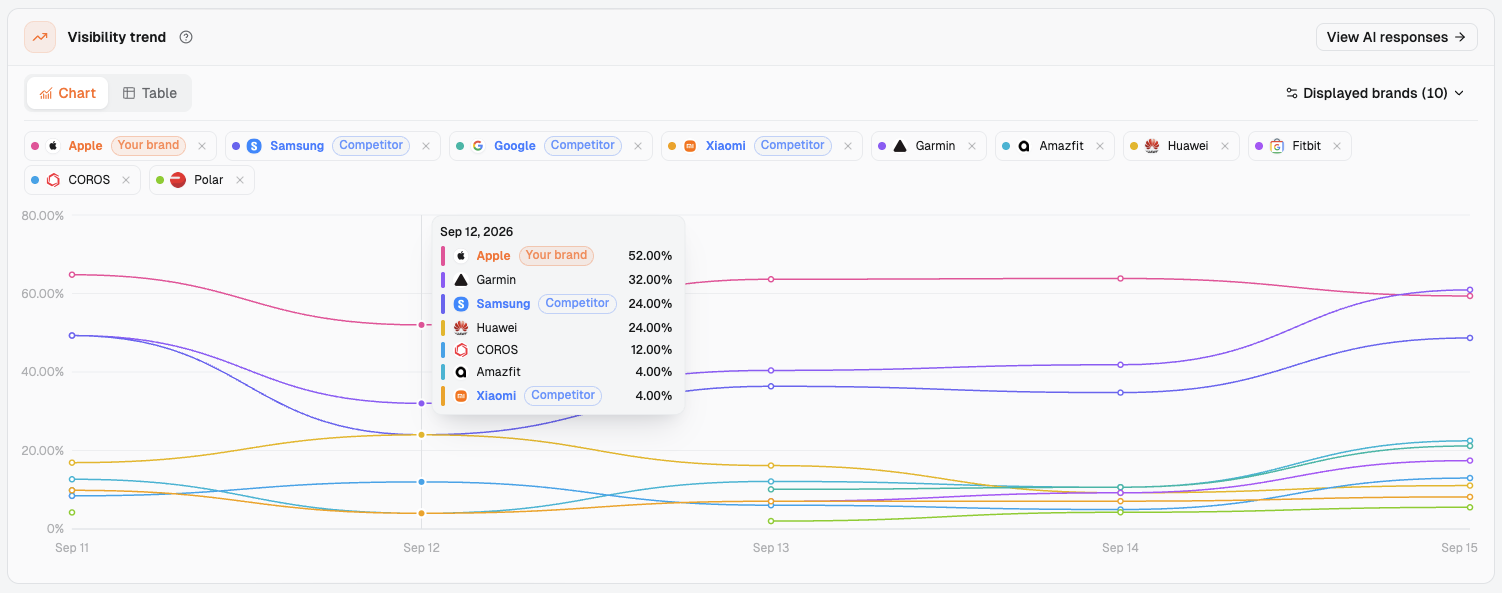
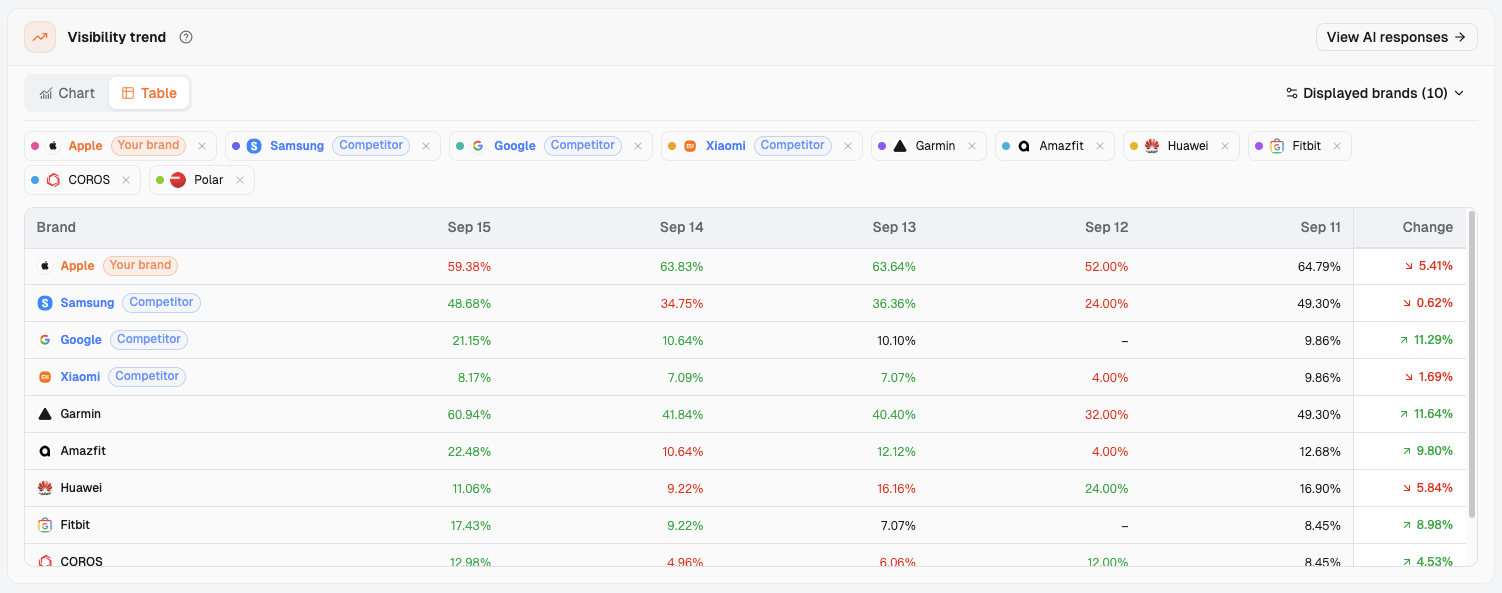
When reading dashboard trends, examine what happened in the middle of the curve too. On October 9, 2026, in Brand overview for Apple's smart watch market, the Table view of Visibility trend showed Apple's values from Sep 11 to Sep 15 as 64.79%, 52.00%, 63.64%, 63.83%, and 59.38%.
Comparing just the start and end gives a decline of 5.41 percentage points. But Sep 12 was more than 11 percentage points below both neighboring days, and the next day returned to 63.64%. A report that gives only the start-to-end decline omits the dip and recovery in between.
Visibility trend in the Chart view of Brand overview (viewed October 9, 2026): hovering over Sep 12 shows Apple at 52.00%, with both neighboring days above 63%.
In the same viewing, the Change column shows a 5.41% decrease for Apple. This corresponds to the last day's 59.38% minus the first day's 64.79%, and should be read as 5.41 percentage points. Keeping both original values makes the report's unit easier to check.
Visibility trend in Table view (viewed October 9, 2026): five daily values for each brand and the Change column. Apple's Change is Sep 15 minus Sep 11.
In the Sep 12 column viewed that day, the brands' values were multiples of 4.00%, such as 52.00%, 24.00%, 32.00%, and 4.00%, while three other brands showed “–”. Values falling into a few fixed steps usually suggest a small response count that day.
The interface provides daily proportions. Confirm each day's response count separately and record it in the worksheet. Neither the Chart hover details nor the Table view shows daily response counts; add those counts beside the corresponding dates in the report before explaining the trend.
4. How to Set Retest Frequency: Build a Baseline, Then Set the Interval
4.1 Write Down Three Quantities First
Decide how many baseline rounds to collect, the interval between rounds, and the total observation period. Together, these determine what evidence will be available by the reporting deadline.
Use the same prompt set during the baseline period to learn how much proportions fluctuate without known changes. One saved round is a starting point; two rounds provide one difference. Further observation lets you check whether the fluctuation range is stable.
Start by aligning the interval with the reporting cycle. The analysis lead works backward from the deadline to schedule the baseline period, subsequent observation period, and actual collection dates, then asks the client to confirm feasibility. Keep fresh responses for each observation period. When records are missing, note which prompt group is affected and arrange another collection.
Work backward from the reporting deadline to set the total observation period. For example, if a monthly report closes at month end and you ask one round a week, you get four rounds in a month. If you agreed on three baseline rounds and two subsequent rounds, you need five, which is more than one month allows. In that case this month's report says “Pending retest,” notes that the baseline is complete and one subsequent round is still missing, and gives the next review date. To write “Change observed” in the current report, all agreed rounds must be complete before the deadline.
4.2 Use the Baseline to Set Your Own Threshold
List each round's proportion within the same scope. Check differences between neighboring rounds, then the span between the lowest and highest values across the baseline period. The team can use this span as the starting point for a fluctuation threshold, recording why it chose it.
Below is a hypothetical example, with numbers used only to show the calculation. Suppose a group has 50 prompts and four baseline rounds. The numbers of prompts mentioning the brand are 20, 22, 19, and 21, giving proportions of 40%, 44%, 38%, and 42%.
The lowest is 38% and the highest is 44%, a fluctuation of 6 percentage points. Set these 6 percentage points as the fluctuation threshold: the size that subsequent changes must exceed. Set the last round's 42% as the baseline comparison value: the proportion used to compare every subsequent round.
If the next two rounds are 46% and 45%, they are only 4 and 3 percentage points above 42%. Record “Pending retest.”
If they are 50% and 49%, they are 8 and 7 percentage points above 42%. Both rounds exceed the 6-percentage-point threshold. Record “Change observed.”
Once the comparison value and threshold are set, use the same comparison value and the same threshold for every subsequent round, with no changes midway. If the business cares only about larger changes, set a higher threshold. Decide all of this before seeing subsequent results.
In this article's data, each combination was collected only twice. The multi-round baseline and “two or more consecutive rounds” described below are reporting methods to fill in using your own subsequent records.
If baseline fluctuation is still widening substantially after another round, keep collecting and label the status “Baseline still being established.” Explain both what you have seen and which round is still needed, so the person approving the report knows what to check next.
4.3 Align the Interval With the Reporting Cycle
Grouping the Apple records in Section 1 by days between collections gives the following combinations that changed outcome.
Interval
Smart watch
Smartphone
Laptop
4 to 6 days
16 of 157 (10.2%)
51 of 647 (7.9%)
55 of 548 (10.0%)
7 days
9 of 100 (9.0%)
36 of 502 (7.2%)
43 of 350 (12.3%)
8 to 10 days
6 of 71 (8.5%)
26 of 326 (8.0%)
34 of 333 (10.2%)
11 to 16 days
5 of 52 (9.6%)
16 of 183 (8.7%)
21 of 180 (11.7%)
Within the 4-to-16-day range in these records, longer or shorter intervals show no consistent pattern of higher or lower proportions changing outcome. The platform and region mix also differs across the interval groups. The team can align the interval with its reporting cycle. These records contain no shorter or longer intervals.
On October 9, 2026, Market overview → Trends displayed daily trends for Sep 11 to Sep 15, five days in total. Plan the interface's display granularity and the team's reporting cycle separately: daily curves show the course of events, while agreed rounds and thresholds determine when to reach a reporting conclusion.
If a page has already been changed, use the plan for comparable observations after changes to save update dates and fresh responses, connecting the reporting plan to the actual changes.
5. Reporting Thresholds: When to Write “Change Observed” or “Pending Retest”
5.1 Use the Evidence to Choose a Conclusion for the Same Clue
Reporting labels depend on which conditions the current records meet. Apply the same standard to rises and falls, so good news gets the same scrutiny as bad news.
What you see
What to write in the report
Next step
A brand or recommendation newly appears in only one response
Pending retest: save it as a new clue
Collect the next round for the original prompt set
The overall proportion rises in one round, within baseline fluctuation
Pending retest: this round rose within the observed fluctuation range
Complete the agreed subsequent rounds, then check against the threshold
Two or more consecutive rounds change in the same direction relative to the same baseline, each exceeds the threshold, and conditions are comparable
Change observed: specify rise or fall, scope, percentage points, and rounds
Continue the original observation plan; gather separate evidence if an explanation is needed
Agreed subsequent rounds are complete, with no change persistently exceeding the threshold
No sustained change within this scope and threshold
Retain the results and continue within the same scope next period
The prompt set, platforms, or regions change during observation
Pending retest: the scope changed; report the two periods separately
Establish a baseline for the affected new scope
Responses for agreed prompts are incomplete, or the baseline is still being established
Pending retest: records are still being completed
Specify missing items and the next review plan
“Two consecutive rounds” means two fresh observation rounds after the baseline is established, each judged against the same baseline comparison value. A proportion that rises and then holds still counts, as long as it stays above the threshold in each round. The team can agree on more rounds based on its baseline fluctuation.
“No sustained change” applies once observation has been completed as agreed. If rounds are unfinished or responses are missing, retain Pending retest and explain what is missing, keeping the judgment open.
5.2 Turn the Principles Into a Reporting Threshold
The analysis lead first settles the prompt set version and the platforms and regions where the prompts will be asked. Keep using that arrangement. Record how many prompts each group has and which responses each round needs. Once the baseline rounds are complete, save the proportion used for comparison, the fluctuation already observed, and the calculation method. Then ask the client's designated approver to confirm the threshold, how many rounds the change must last, and the reporting deadline.
First check how much this group's proportions have already moved during the baseline period, then use that size to set the threshold. If the business cares only about larger changes, set a higher threshold and record why. On reporting day, check each group. Write “Change observed” only for groups that meet the conditions.
Put this rule in the team worksheet, filling in the parentheses with actual details:
For (prompt count) core prompts in (market / prompt set version / platform / region), first complete (baseline rounds) baseline rounds on (actual dates), with (agreed interval) between rounds. Fix the baseline comparison value at (proportion) and record fluctuation of (percentage points) using (calculation method). If each of (at least two subsequent rounds, with the exact count confirmed by the team) fresh observation rounds changes in the same direction relative to that baseline, each change exceeds (threshold in percentage points), and responses and scope are complete, write “Change observed.” Complete subsequent rounds before (deadline), with the conclusion approved by (approver); for other cases, use the decision table.
Filled in using the hypothetical example above:
For 50 core prompts in (market / prompt set version / platform / region), first complete four baseline rounds on (actual dates), with (agreed interval) between rounds. The numbers of prompts mentioning the brand are 20, 22, 19, and 21, giving proportions of 40%, 44%, 38%, and 42%. The lowest is 38% and the highest is 44%, a fluctuation of 6 percentage points. Set the last round's 42% as the baseline comparison value and set the threshold at 6 percentage points. If the next two rounds are 46% and 45%, they are 4 and 3 percentage points above 42%; record “Pending retest.” If they are 50% and 49%, they are 8 and 7 percentage points higher. Both rounds exceed the threshold. With complete responses and unchanged prompts, platforms, and regions, record “Change observed.” Complete both subsequent rounds before (deadline), with the conclusion approved by (approver).
Fill in the rule before reviewing the new recommendation intended for the weekly report. The approver is approving a reusable standard, and each subsequent conclusion is checked against it. If the rule needs changing, save the change date and reason, and identify which records will use it first.
5.3 Gather Evidence Separately for Change and Its Cause
“This group's proportion changed” rests on comparable records. “This page update caused the change” also requires the change date, the edited content, and evidence of which facts and sources fresh responses used. Attach the appropriate evidence to each conclusion.
For metric meanings, source checks, and review worksheets after a page update, follow the method for checking metrics and response evidence after page updates. First record known changes during the period in the observation note, then inspect responses to see whether those changes were used.
Measure sales share and return on spend separately using sales and financial records. The threshold here addresses changes in the selected AI responses; the business lead can use it to decide whether further investigation is needed.
5.4 Attach a Standard Observation Note to Every Conclusion
A “Change observed” statement should come with its scope. The note should specify at least prompt count, platforms, regions, rounds and dates, actual change, changes made during the period, and evidence still missing. Readers can then return to the corresponding records to check it.
Use a standard template:
In (market), for (prompt count) prompts in fixed prompt set (version), collect (round count) rounds of fresh responses on (dates) across (platforms / regions), with (count) valid comparable responses in each round. The baseline is (rounds and dates), the comparison value is (proportion), and the threshold is (percentage points). Subsequent round proportions are (actual values), changing by (percentage points) relative to the baseline. Under the agreed consecutive-round requirement, this observation is recorded as (reporting status). Known changes during the period are (dates, items, content); evidence still missing is (specific items).
If you are this brand, you could attach the following note to Apple's smart watch records:
This observation uses responses Dageno collected in the smart watch market from August 3 to 19, 2026: 380 combinations involving 302 distinct prompts, covering four platforms—Google AI Mode, Gemini, ChatGPT, and Google AI Overview—and 22 regions. The first round took place from August 3 to 5, and the second from August 10 to 19, including 202 combinations on August 10. Apple appeared in 245 combinations (64.47%) in the first round and 233 (61.32%) in the second, a decline of about 3.2 percentage points (12 combinations). There were no corresponding page changes known to us during this period. There are currently only two rounds of records, so this observation is recorded as “Pending retest.” The next step is to establish this group's baseline and continue observation over the agreed rounds.
Dates vary by combination in this example, so the note gives date ranges. Fill in your own note using actual records, choosing the label supported by the evidence already collected.
6. Retest Records: What to Fix and How to Record Changes
6.1 Fix Prompt Wording, Scope, and Counting Rules
Fix prompt wording, platform, region, and language. Keep the asking conditions the same in each round too. Agree on how to group brand names: for example, does Apple Watch count as Apple? It is counted separately in this article. Also agree on which responses enter the proportion: for example, do responses mentioning no brands count? If the same prompt has two responses on the same day, agree beforehand which one to keep to avoid counting it twice. Save core prompts using the method for maintaining the prompt set, and preserve evidence of changes and responses using the review records for changes and responses.
If budget, model, use case, or wording changes, record a new prompt version. Keep the original core prompts and judge conclusions for the old scope within that scope. This lets you check whether results for original prompts persist as new needs are added.
6.2 Record Changes in One Table
Date
What changed (prompt set, platform scope, region, page)
Which conclusions are affected
Which round starts the new baseline
Actual change date
Actual scope or page content changed, with a version or URL
Affected groups and conclusions; retain original scope records
If observation scope or counting rules change, enter the new scope's first round; if only the page changes and scope stays fixed, retain the original baseline and record the first subsequent observation round
(Example) October 12
5 budget-related prompts added to the prompt set
The overall proportion for that platform-and-region group
The original 50 prompts keep the original baseline; the 5 new prompts are recorded separately starting with the October 13 round and are merged in after they have enough baseline rounds
The second row of the table is an example; its date and counts only show how to fill it in. When observation conditions change, report the earlier and later proportions separately and establish a starting point for the new scope. If only page content changes while prompts and counting scope stay fixed, retain the original baseline and use subsequent records to check for change. Define how to handle old and new conditions before collection and have the responsible person confirm it.
7. Conclusion
When a new recommendation appears, the analysis lead first saves the response, then checks whether the full prompt set, records from multiple rounds, and threshold are ready. If agreed conditions are met, write “Change observed” with a clear scope. If evidence is missing, write “Pending retest.” If observation is complete and change has not persisted, report the result within this scope.
Ask the client to confirm the reporting threshold, specifying prompt count, baseline and subsequent rounds, interval, change threshold, and approver. Attach an observation note to each conclusion, keeping actual dates, changes during the period, and missing evidence, then agree on the next review date.
Start understanding your brand's AI search performance
Does testing the same prompt on three platforms count as three prompts?
There is still one distinct prompt; record its platform and region combinations separately. Keep distinct prompt count, combination count, and response count in the report. Judge each platform and region group using its own prompt count and baseline.
Should a report use percentage points or percentages?
When comparing appearance proportions across two rounds, write the difference in percentage points and retain both original values. In Apple's smart watch Visibility trend table viewed October 9, 2026, the first day was 64.79% and the last was 59.38%; the Change column shows a 5.41% decrease. Subtracting those two proportions gives a decline of 5.41 percentage points for the report.
Can we compare this round directly with the previous one if some responses are missing?
First confirm why responses are missing and complete the original prompts. If you temporarily compare only the scope with complete responses in both rounds, note the narrowed scope and count. Keep the original agreed scope Pending retest and judge it once the gaps are filled.
What happens to the original conclusion if the next round returns to baseline after the monthly report?
Keep the old report's date and supporting evidence. In the new report, update the conclusion to “The change did not persist in subsequent observation,” specifying the range it returned to. The agreed person should update the conclusion and retain all rounds so others can check the basis for the earlier judgment.
How should we report a sustained rise in an important region when the overall market looks unchanged?
Report the overall market and that region separately. If the region reaches its own threshold, write “Change observed” for that region, with prompt count, rounds, and dates. Choose the overall status from its own records.
9. References
Responses Dageno collected in the smart watch, smartphone, and laptop markets from August 3 to 19, 2026: results collected again a few days later for the same prompt on the same platform in the same region, plus records from randomly selected combinations and daily counts.
Dageno is the research and insights team at Dageno AI, publishing industry reports and expert analysis on AI Search Visibility, Generative Engine Optimization (GEO), and AI-powered search discovery.