Estée Lauder and Profound: How AI Search Ranks Foundations
After The Estée Lauder Companies announced its Profound partnership, we looked up the Estée Lauder brand in Dageno’s public market data. It ranks #2 in Foundations, but segments, AI platforms, regions, buying intents, attributes, and shopping cards each tell a different story. Here is what to read first.
Explore 12,000+ niche markets with no login required
Updated by
AI-assisted for research support
13 Min Read•
Updated on Oct 10, 2026
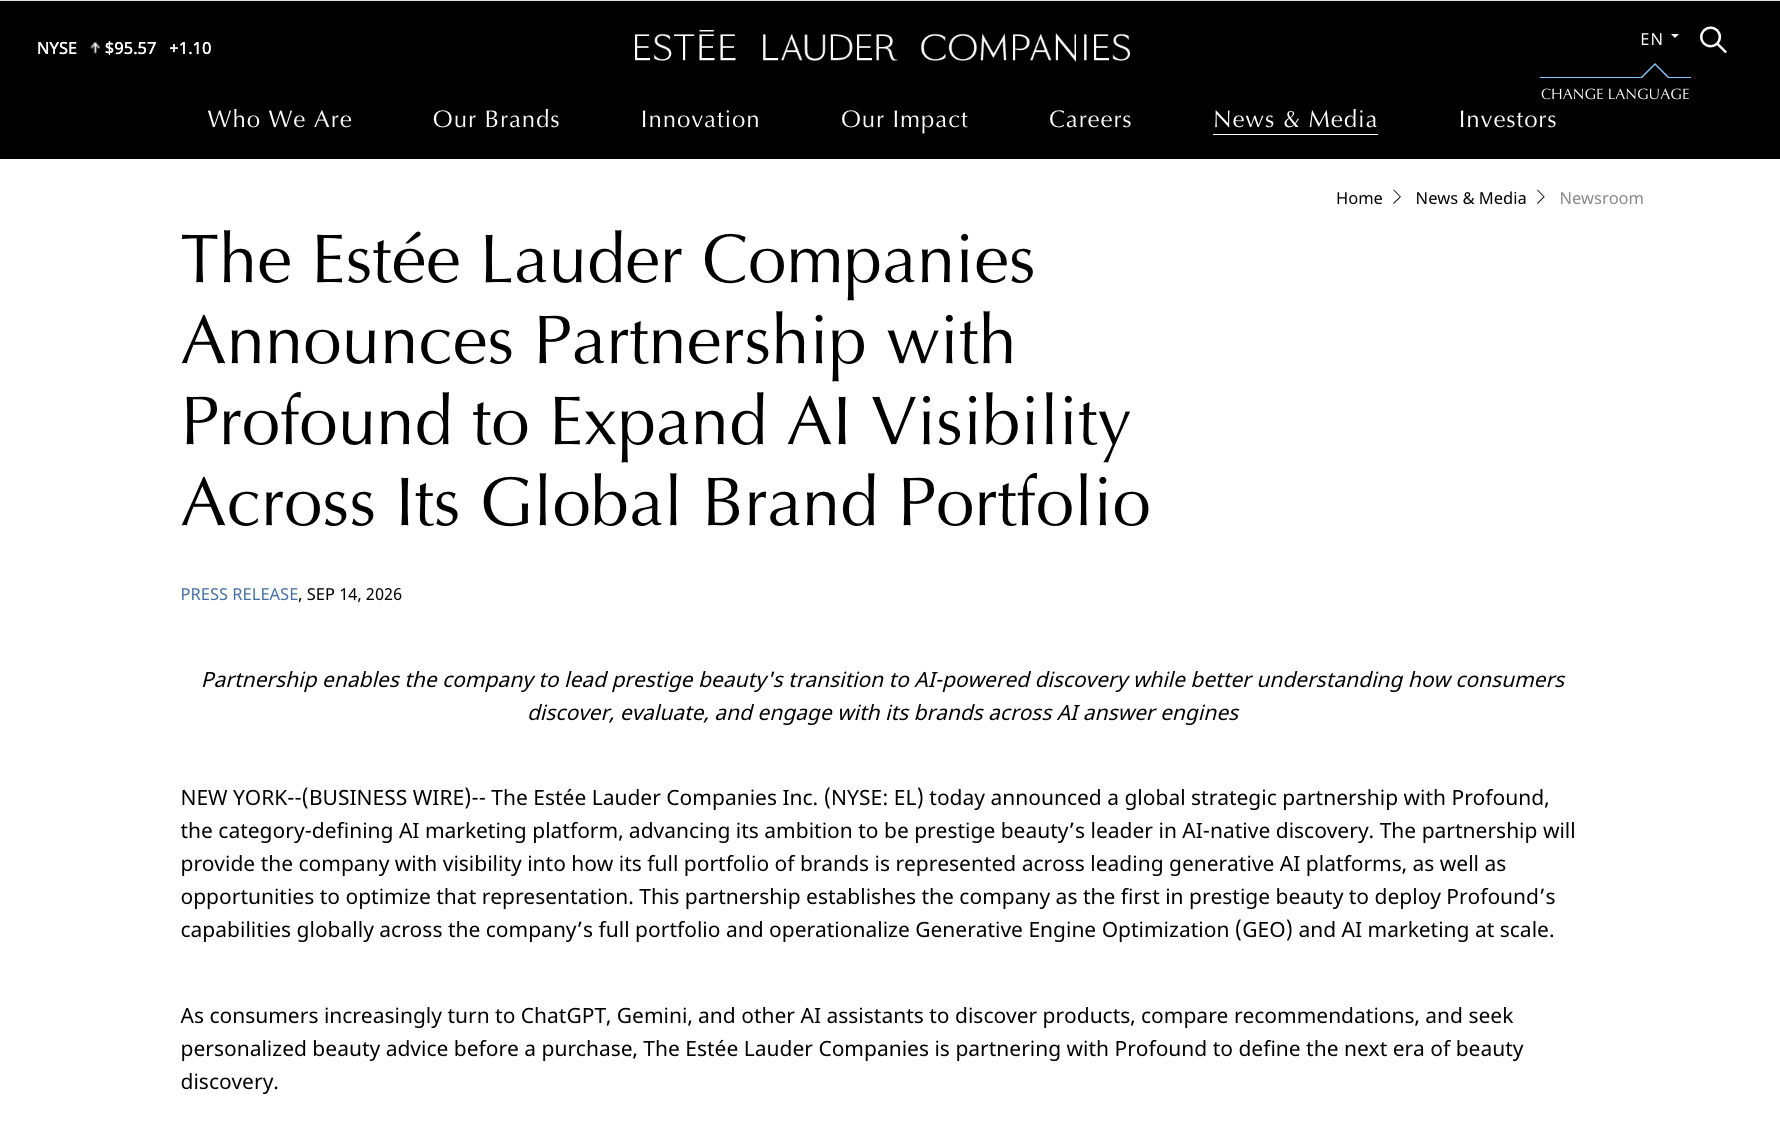
On September 14, 2026, The Estée Lauder Companies announced a partnership with Profound, a platform that tracks how brands appear in AI answers. The stated goal is to see how the group's brands are described, compared, and recommended across the major AI platforms, then feed those findings back into product pages, blogs, and videos.
Figure 1: The September 14, 2026 press release announcing the global partnership with Profound.
For a group with dozens of brands selling in many countries, that is more than checking a handful of prompt rankings each week.
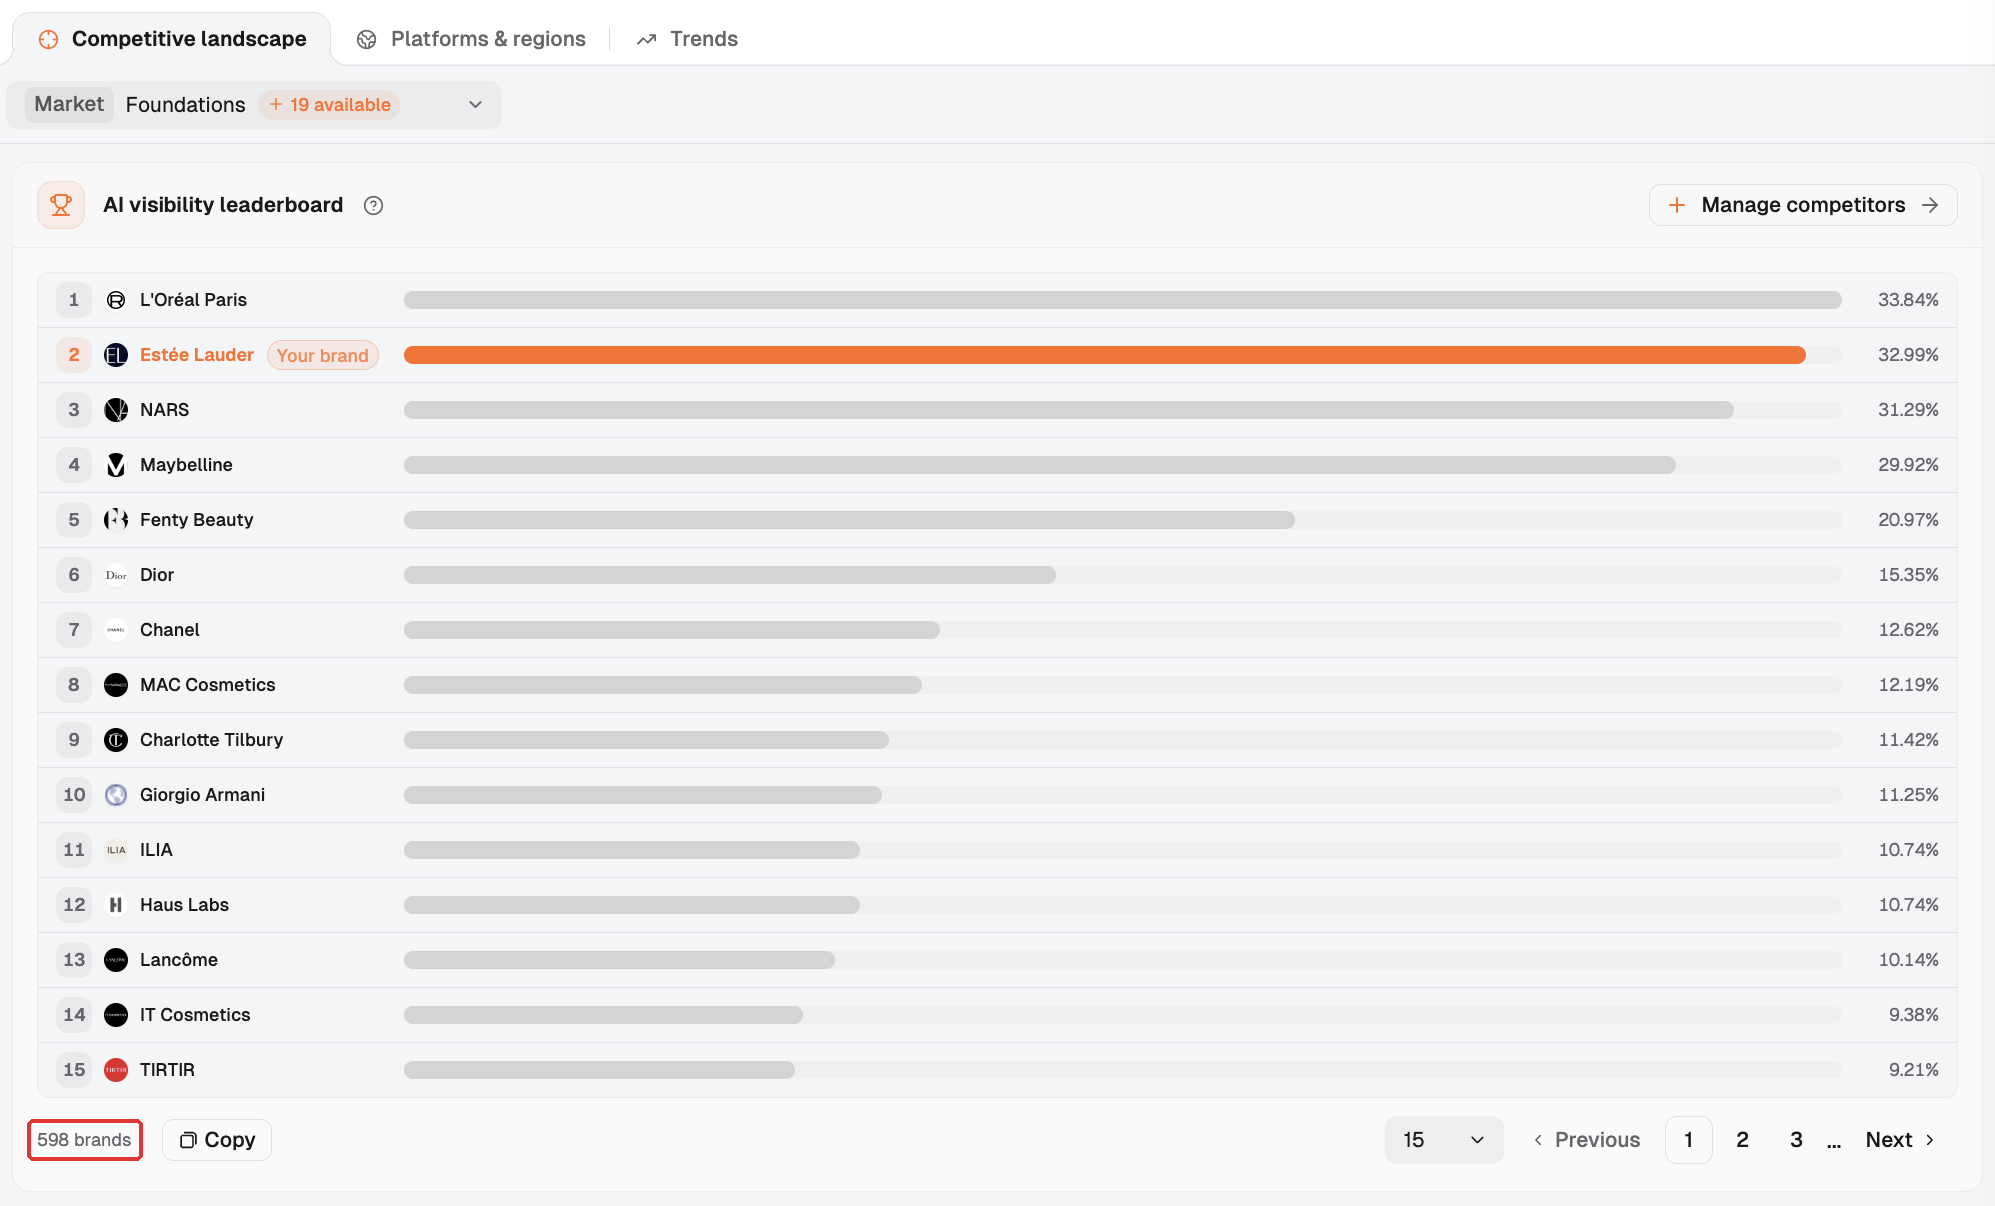
After reading the announcement, we looked up Estée Lauder in Dageno's public market data to see where one specific brand stands in AI search. Estée Lauder has 32.99% AI visibility in the Foundations market, ranking #2 among 598 brands. L'Oréal Paris leads at 33.84%, a gap of just 0.85 percentage points. That looks like a strong position. But does the #2 ranking hold when we change the segment, platform, or region?
This analysis covers the Estée Lauder brand, not combined results for The Estée Lauder Companies. Clinique, M·A·C, and La Mer appear as separate brands in the data.
Data: Dageno public market data, screenshots taken September 29, 2026.
A strong Foundations ranking
The AI visibility leaderboard puts L'Oréal Paris first, Estée Lauder second, and NARS third. AI visibility is the share of sampled AI answers in this market that mention the brand. Estée Lauder is close to the leader, but this ranking describes one market and its AI answers. It cannot show performance across every product category or buying question.
The leaderboard is a starting point. Which competitors appear beside the brand, and does the pattern hold for more specific questions? The next views provide context.
Figure 2: The Foundations leaderboard places Estée Lauder between L'Oréal Paris and NARS.
Change the segment, change the rank
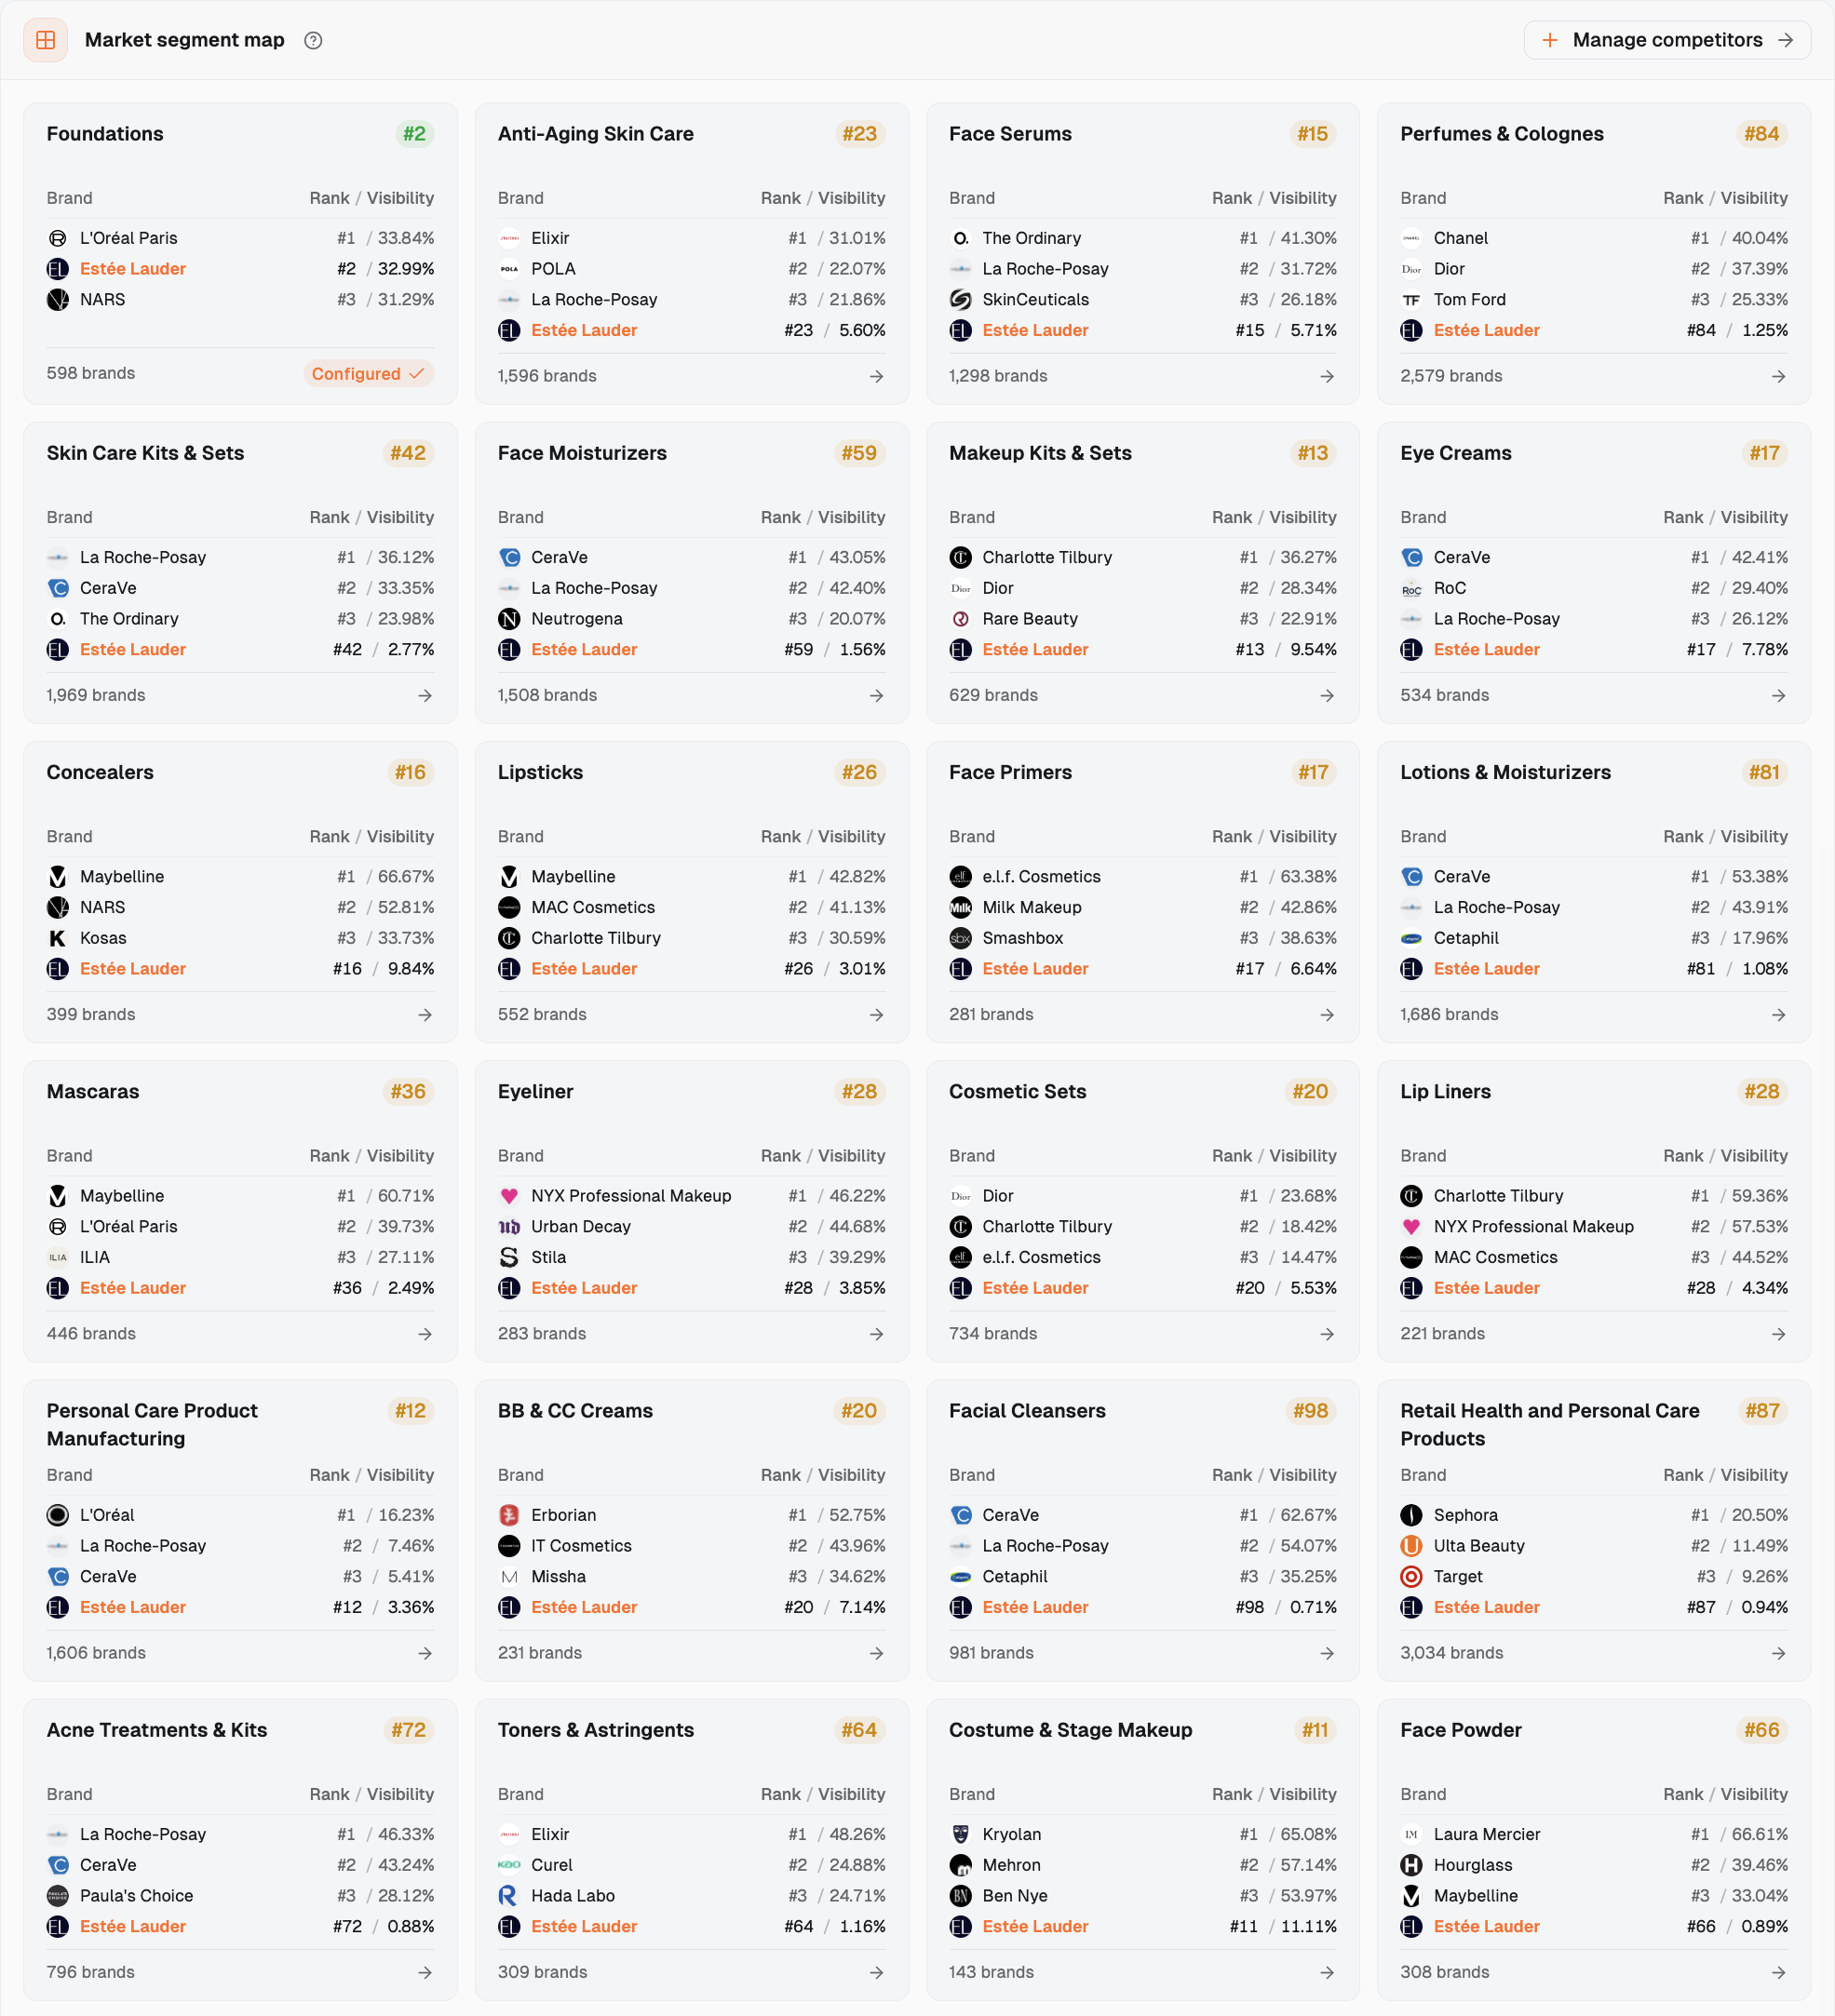
The market segment map tells a less uniform story. Estée Lauder ranks #15 in Face Serums, #23 in Anti-Aging Skin Care, and #84 in Perfumes & Colognes. Each segment has its own competitors and recommendation context.
These ranks do not establish that The Estée Lauder Companies is weak in those businesses. Other brands in the group may cover those product lines. The practical question is which buying situations the Estée Lauder brand wants to own. If a segment matters to its strategy, the gap deserves investigation. A low rank alone is not a reason to produce more content.
Figure 3: The market segment map shows how the same brand moves across product categories.
Platform rankings diverge
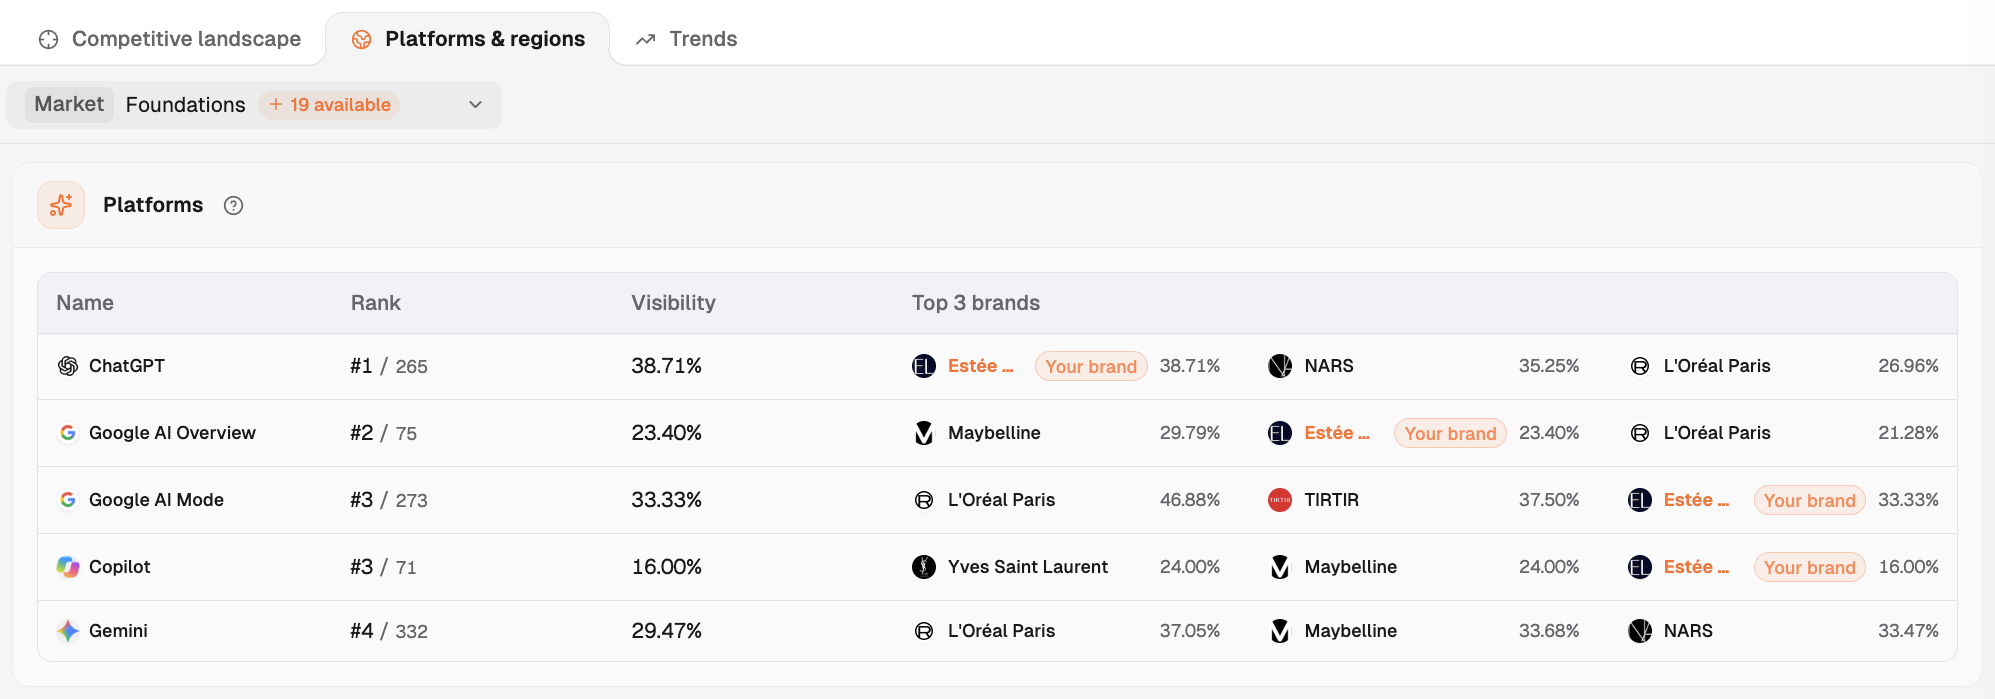
Even within Foundations, there is no single platform ranking. Estée Lauder is #1 on ChatGPT, #2 on Google AI Overview, #3 on Google AI Mode, #3 on Copilot, and #4 on Gemini. A brand can therefore be highly visible in the overall market while its position changes across the interfaces people actually use.
The follow-up is to inspect questions and answers behind each platform view. Are the assistants addressing similar needs? Which alternatives and sources recur? A rank identifies where to look; the responses help explain why.
Figure 4: The platform view shows different ranks for the same brand and market.
Geography changes the picture
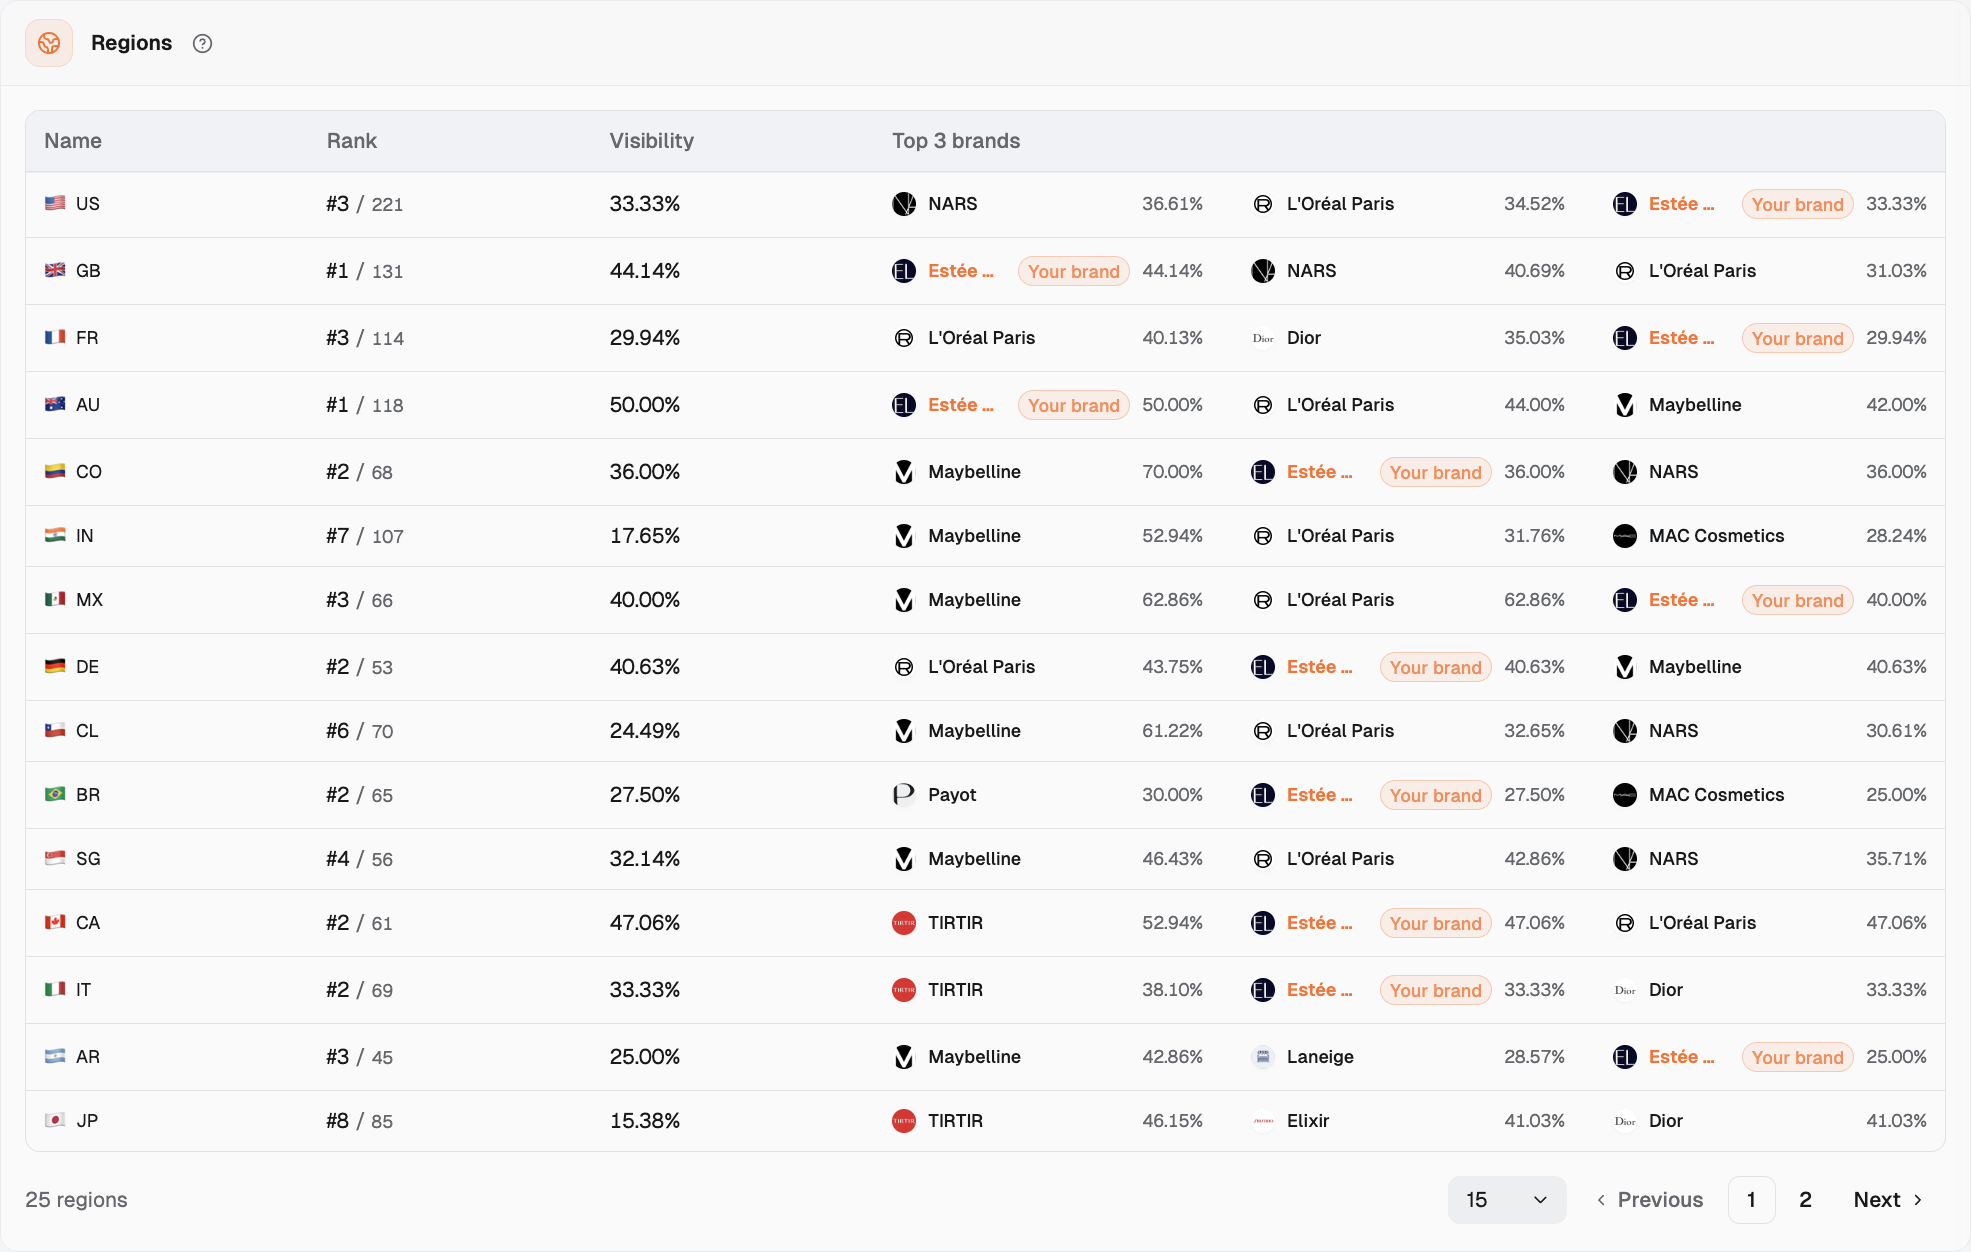
The regional view adds another layer. Estée Lauder ranks #1 in the UK and Australia, #3 in the US and France, #7 in India, and #8 in Japan. These differences point to questions about local recommendations: which competitors recur, which needs are being discussed, and which sources do AI systems cite in each region?
Platform and regional samples differ, so their visibility percentages cannot be compared directly. The ranks flag places to investigate, but do not explain whether differences reflect product fit, local content, third-party coverage, or the questions sampled.
Figure 5: The regional view puts the brand's Foundations ranking in local context.
Fixed-prompt tracking, the standard approach in GEO tools (generative engine optimization: getting a brand mentioned and recommended in AI answers), is well suited to watching a set of important questions over time. Dageno's market view comes one step earlier: it organizes continuously collected AI answers into markets, segments, intents, brands, and competitive relationships, so teams can find which questions deserve long-term tracking. Both have their uses. The order matters.
Buying intent narrows the question
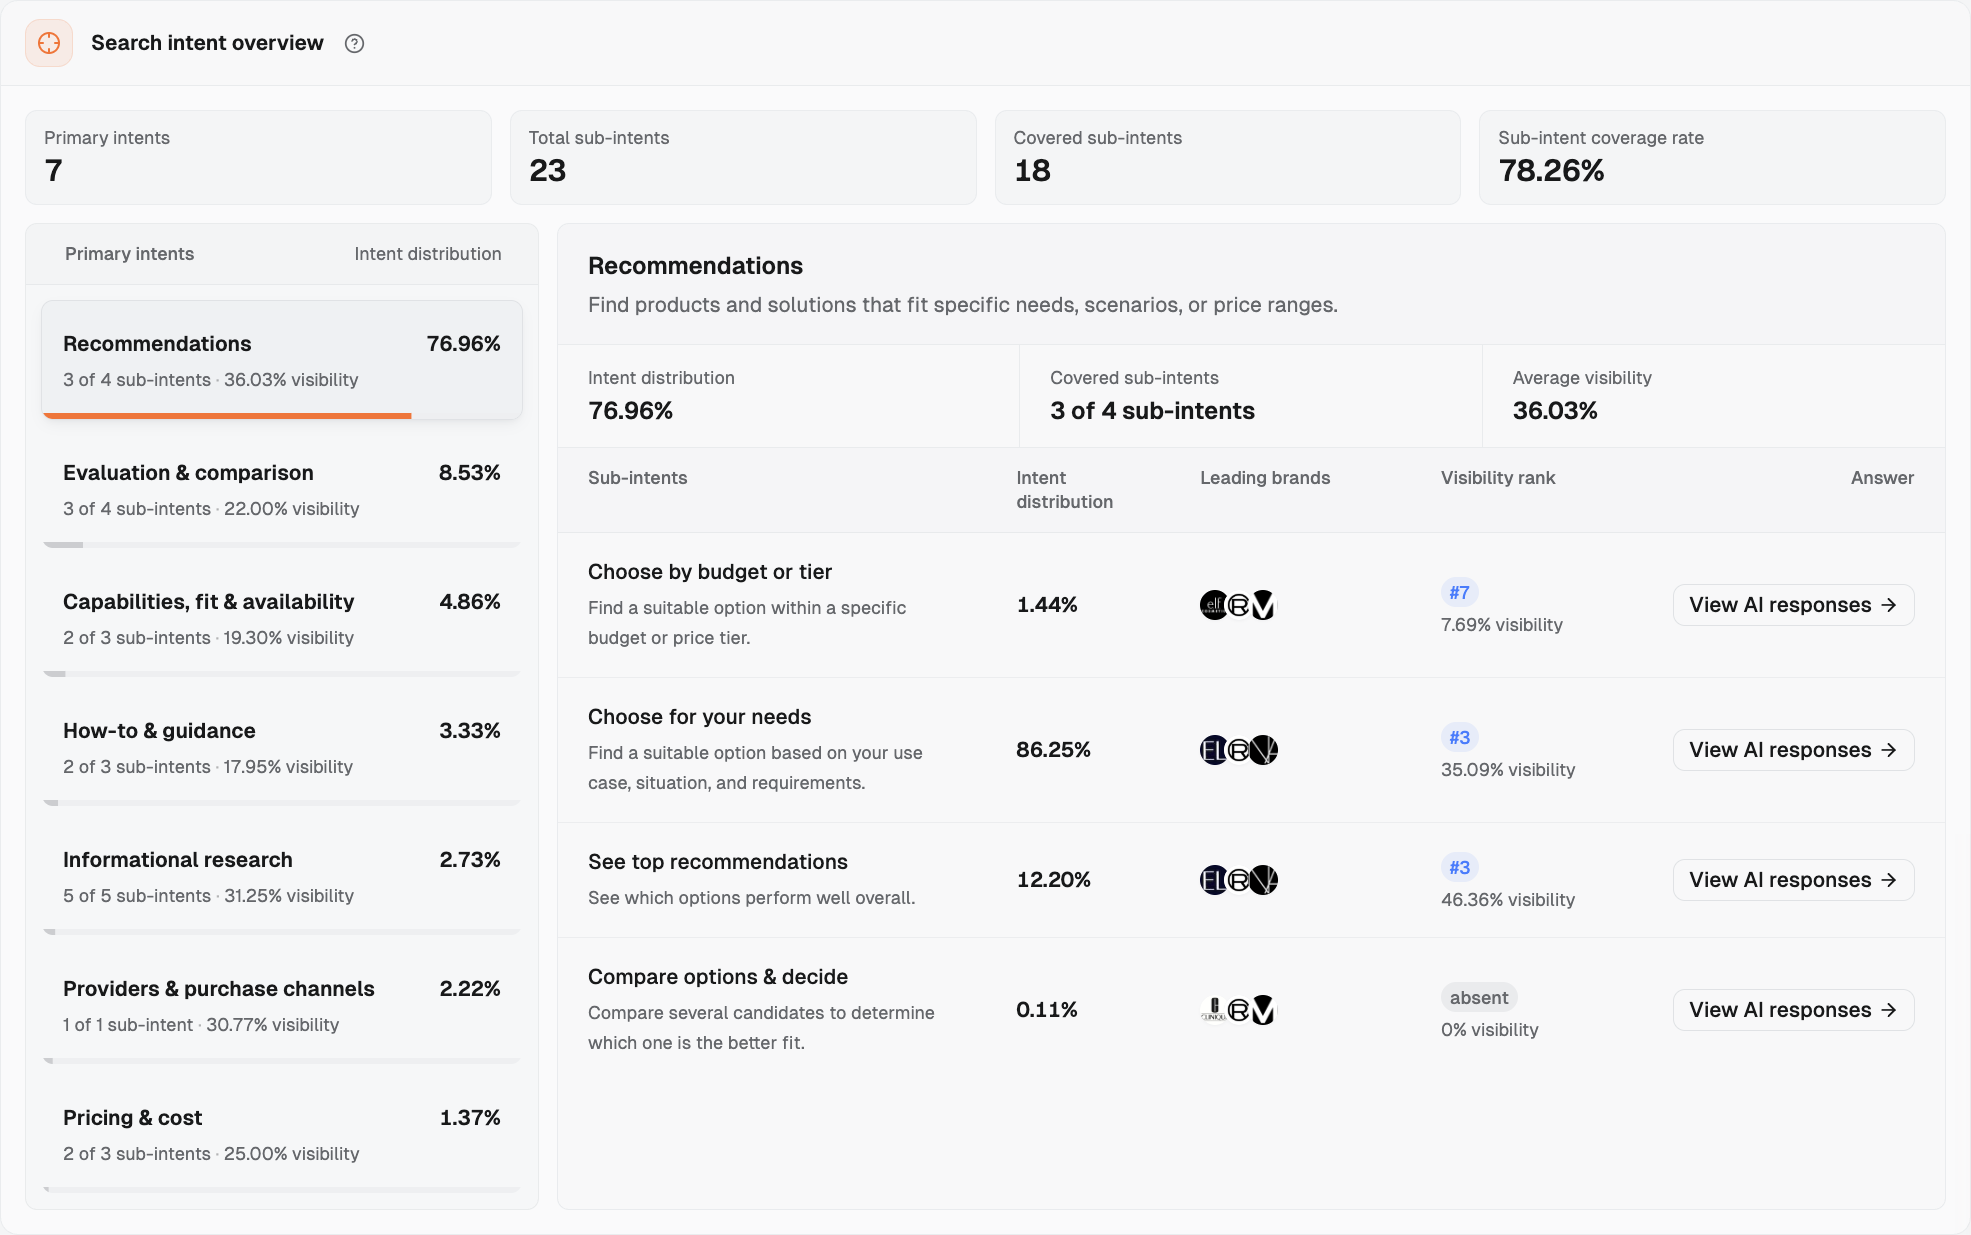
The Search intent overview organizes the sampled buying questions into 7 primary intents and 23 sub-intents. An intent is what the shopper is trying to get done, such as choosing a foundation on a budget. Estée Lauder appears in 18 of those sub-intents. That coverage is more informative when paired with the specific kind of decision a shopper is trying to make.
Within the recommendation group, the brand ranks #3 for Choose for your needs and #3 for See top recommendations. It ranks #7 for Choose by budget or tier. That sub-intent accounts for just 1.44% of questions within Recommendations. Treating that row as a broad verdict on price positioning would overstate what this slice can support.
The next step is to inspect relevant AI responses for prices, use cases, and alternatives. Seeing the market, segments, and buying intents first helps identify questions worth tracking over time.
Figure 6: The intent view separates broad recommendation visibility from specific buying needs.
What attributes does AI connect to the brand?
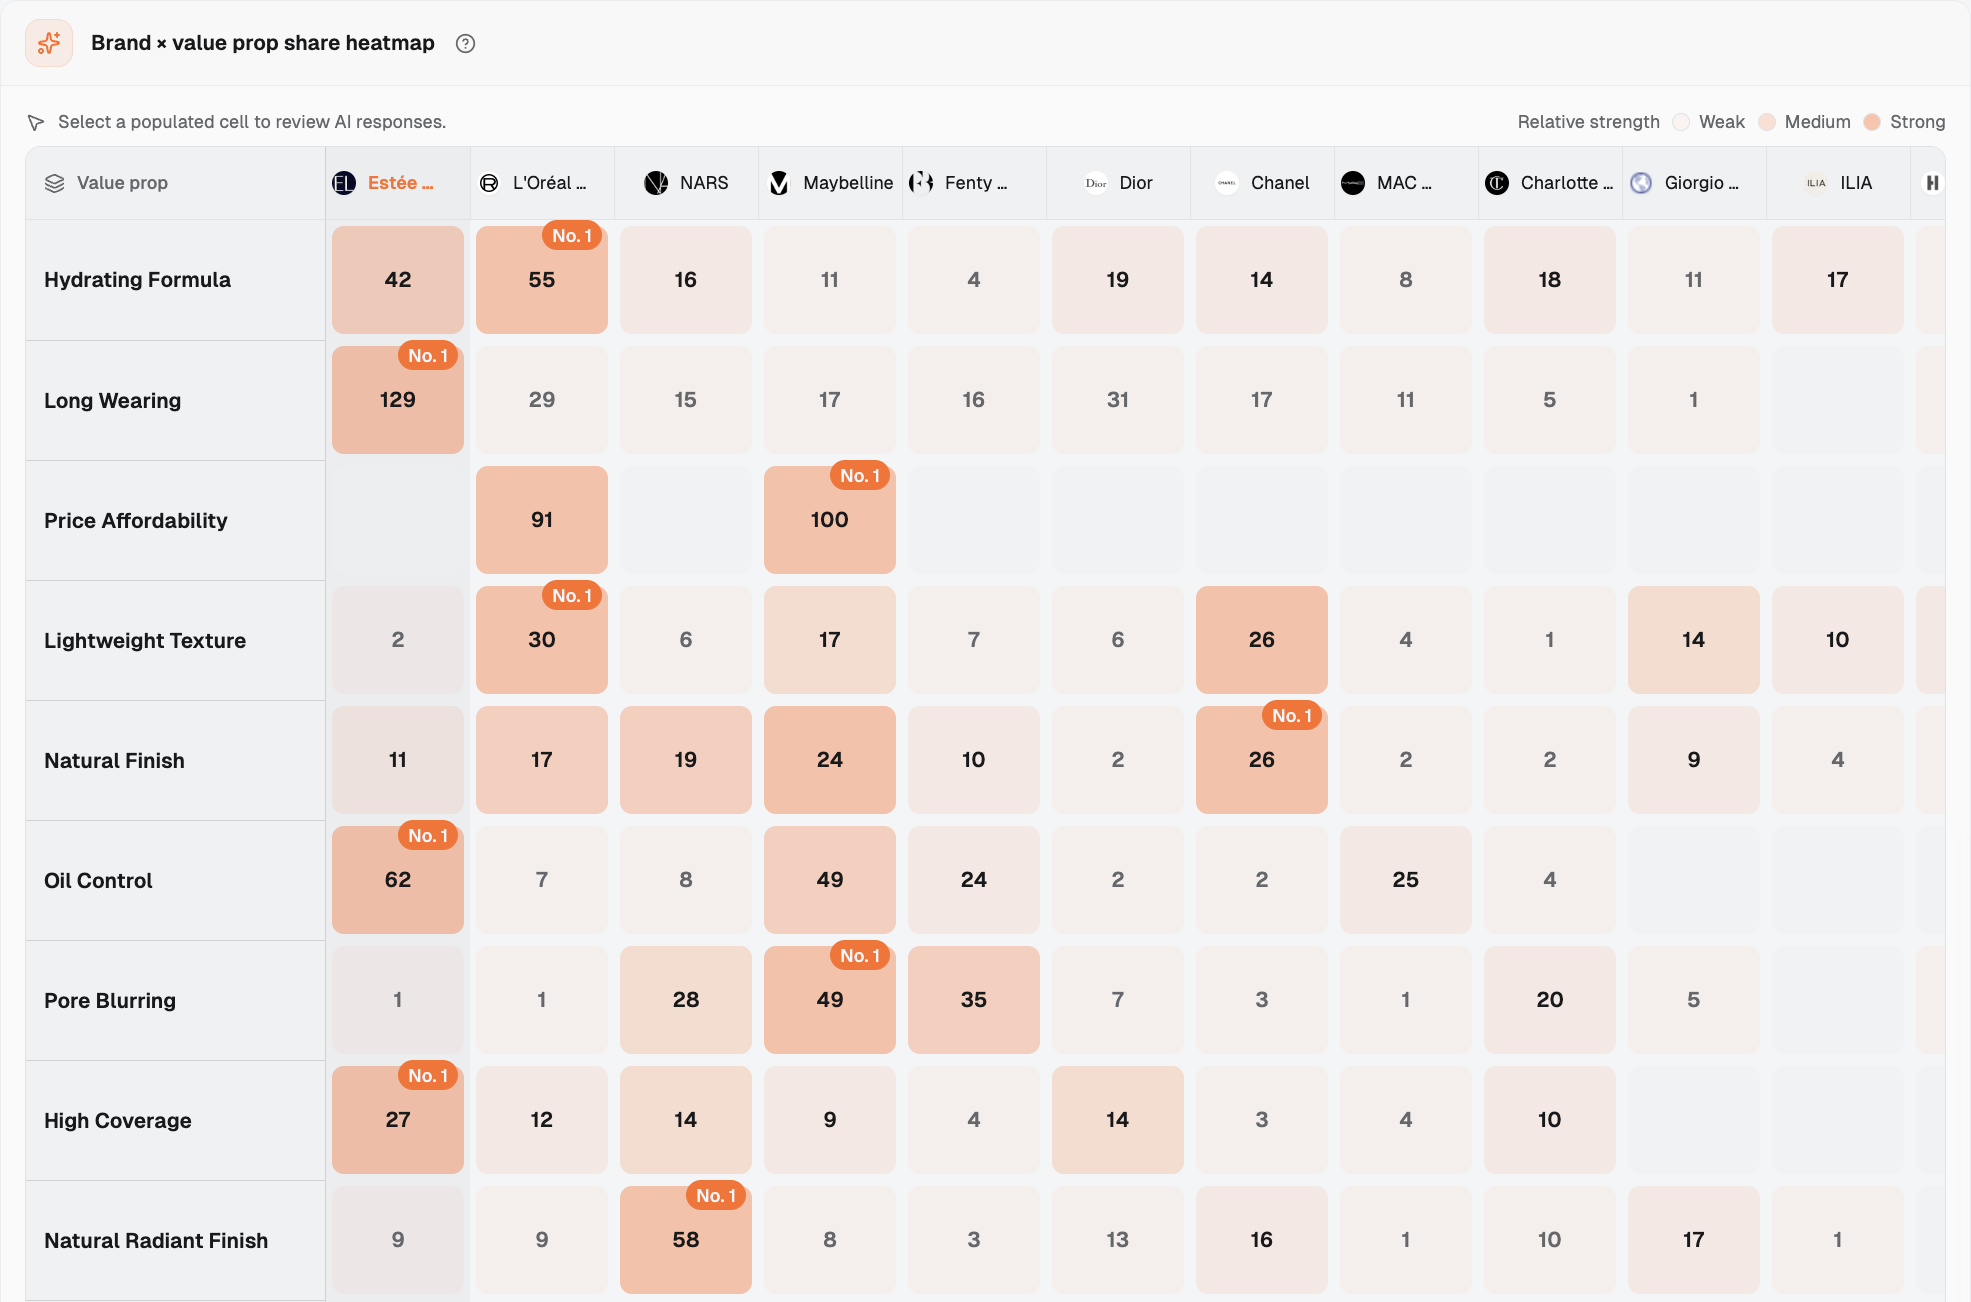
The value-prop heatmap shifts attention from whether Estée Lauder appears to why it may be mentioned. In the shown sample, the brand has 129 answer mentions linked to Long Wearing and 62 linked to Oil Control, ranking No. 1 on both attributes. For Hydrating Formula, L'Oréal Paris has 55 associations and Estée Lauder has 42.
These are associations in AI answers, not product performance tests. They show which brands AI connects with these attributes, not whether a foundation performs better.
If the brand wants to win shoppers looking for a foundation that is both long-wearing and hydrating, do its product pages describe that use case, and do independent reviews support it? The product may also be poorly suited to the need. The heatmap points to a question; responses and cited evidence are needed before acting.
Figure 7: Long Wearing and Oil Control are strongest for Estée Lauder; Hydrating Formula favors L'Oréal Paris in this view.
AI shopping has a different leader
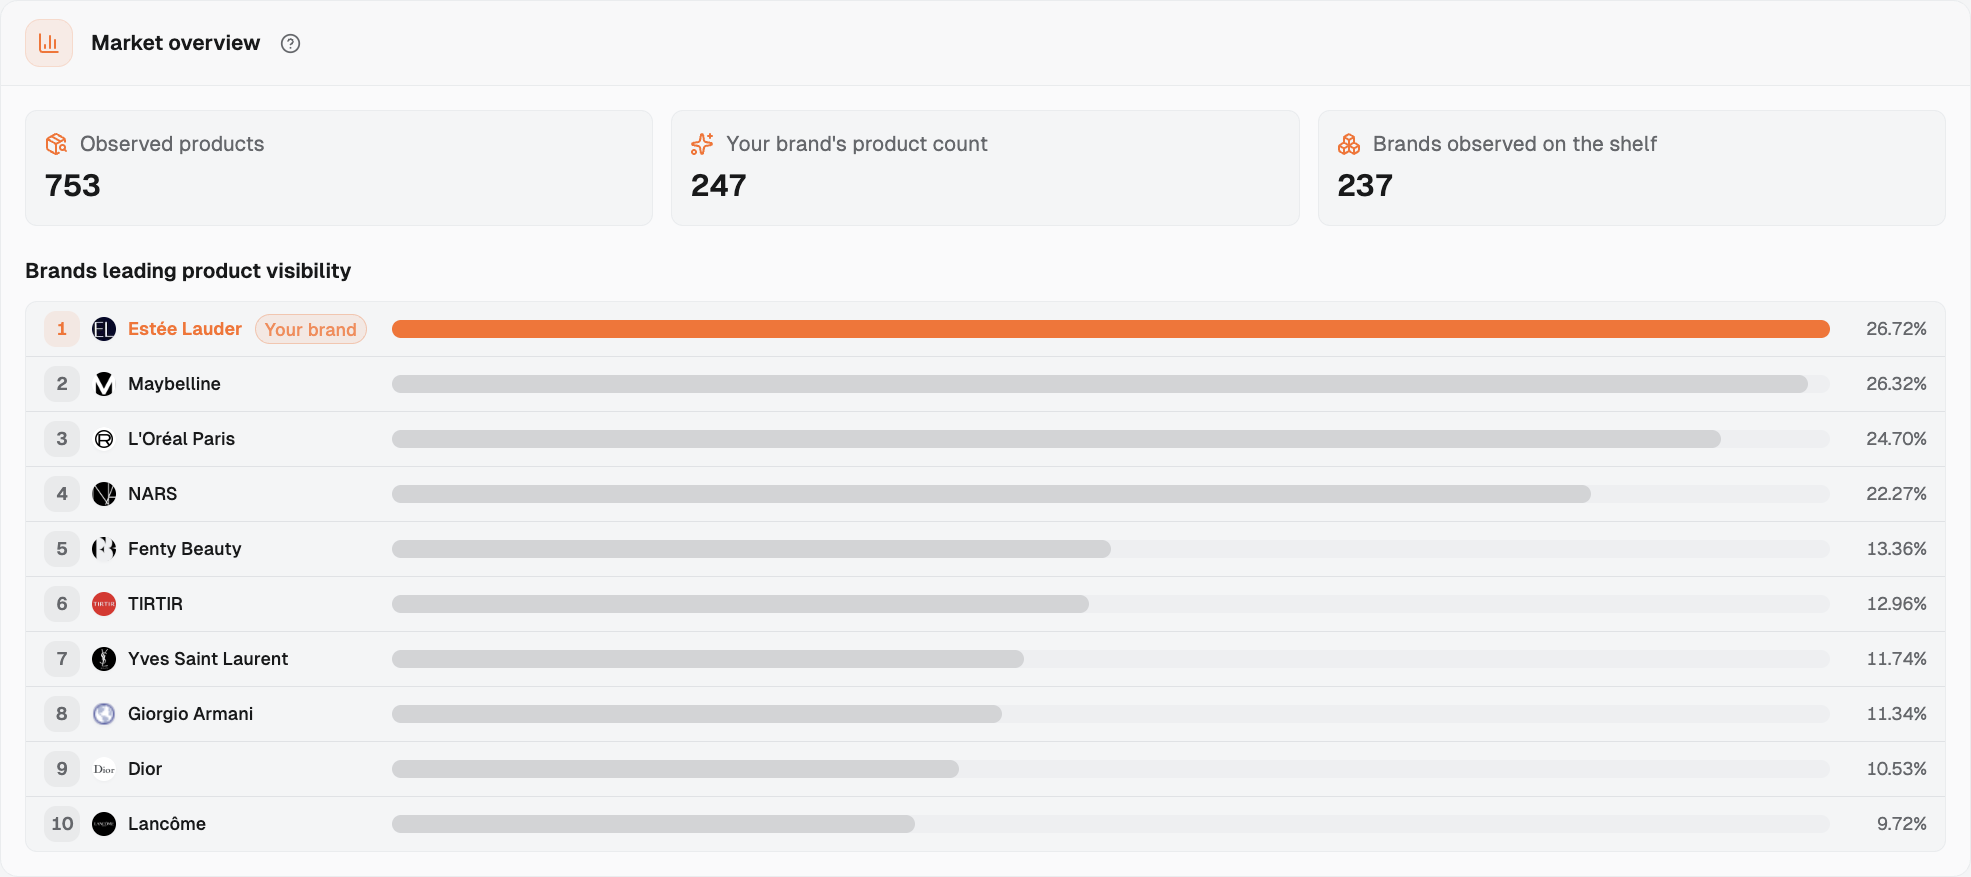
AI answers do not only recommend brands in text. They also show product cards: product listings with an image and a price. The shopping view changes the measure again. Under Brands leading product visibility, Estée Lauder ranks #1 at 26.72%, followed by Maybelline at 26.32% and L'Oréal Paris at 24.70%. In the text-answer leaderboard, Estée Lauder was #2. The positions are not contradictory: a brand being named in an answer and a product appearing in a shopping card are different opportunities, measured in different samples.
That distinction changes the follow-up. Text recommendations invite scrutiny of AI's language and sources. Product cards call for checking which items appear and how they are presented. Both measures matter to the market assessment.
Figure 8: The shopping brand view puts Estée Lauder first for product visibility.
Brand strength does not cover every product
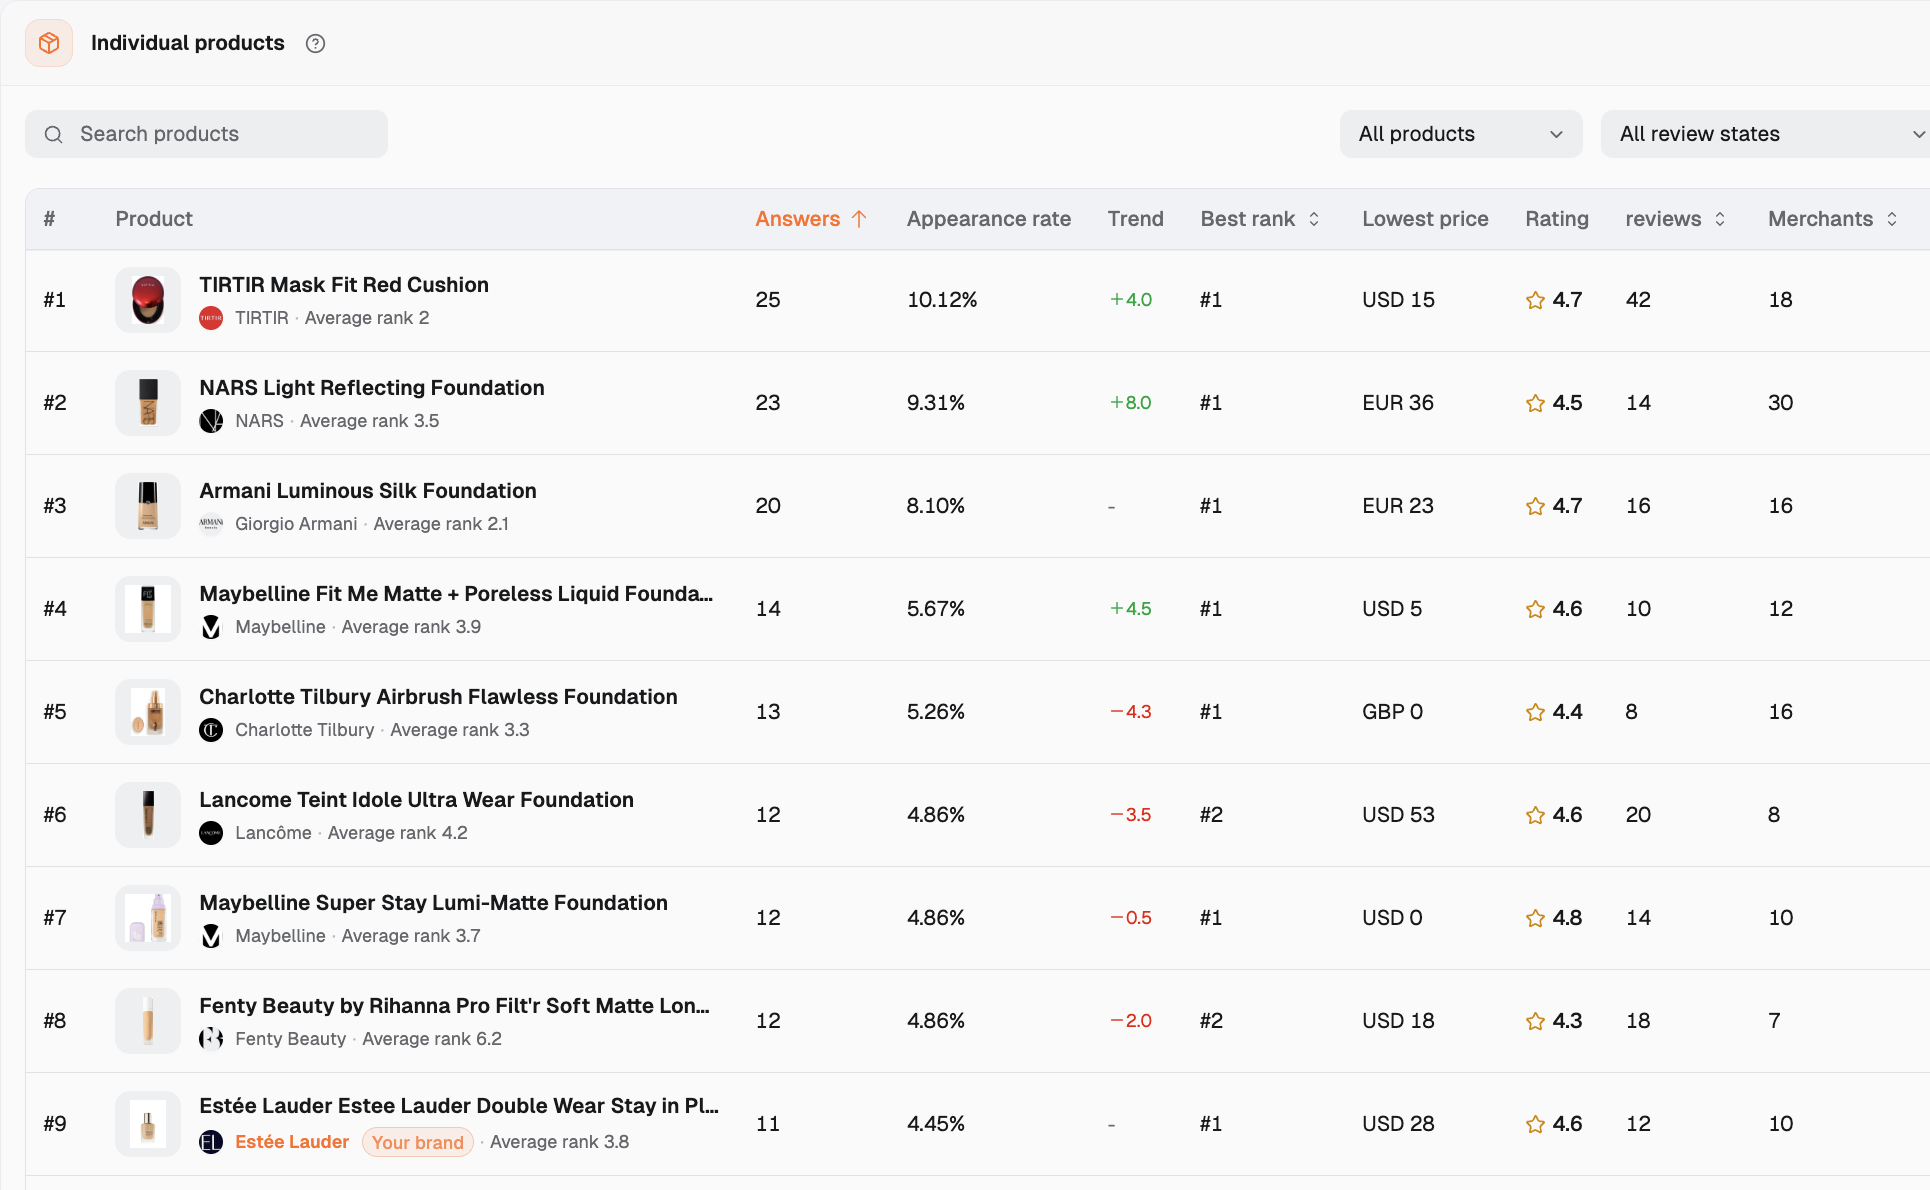
The Individual products list makes the shopping result more concrete. TIRTIR Mask Fit Red Cushion appears in 25 product-card answers, NARS Light Reflecting Foundation in 23, and an Estée Lauder Double Wear product in 11. The Double Wear entry sits at #9 in the displayed list.
Leading the shopping brand view does not put every product in the most prominent spot. The item list shows which products surface, which competitors surround them, and whether those items match what the brand expects shoppers to find.
Figure 9: The Individual products view shows different answer counts for prominent foundation products.
The commercial side of AI answers is getting more complex. Beyond mentions and citations in organic answers, brands need to watch product cards. On platforms that already run ads, they also need to see which questions trigger ads, who is buying them, and where the creative sends users. Put these signals back into one market view, and it becomes easier to decide whether to fix product information, add content evidence, improve product presentation, or adjust ad spend.
Follow the cited sources
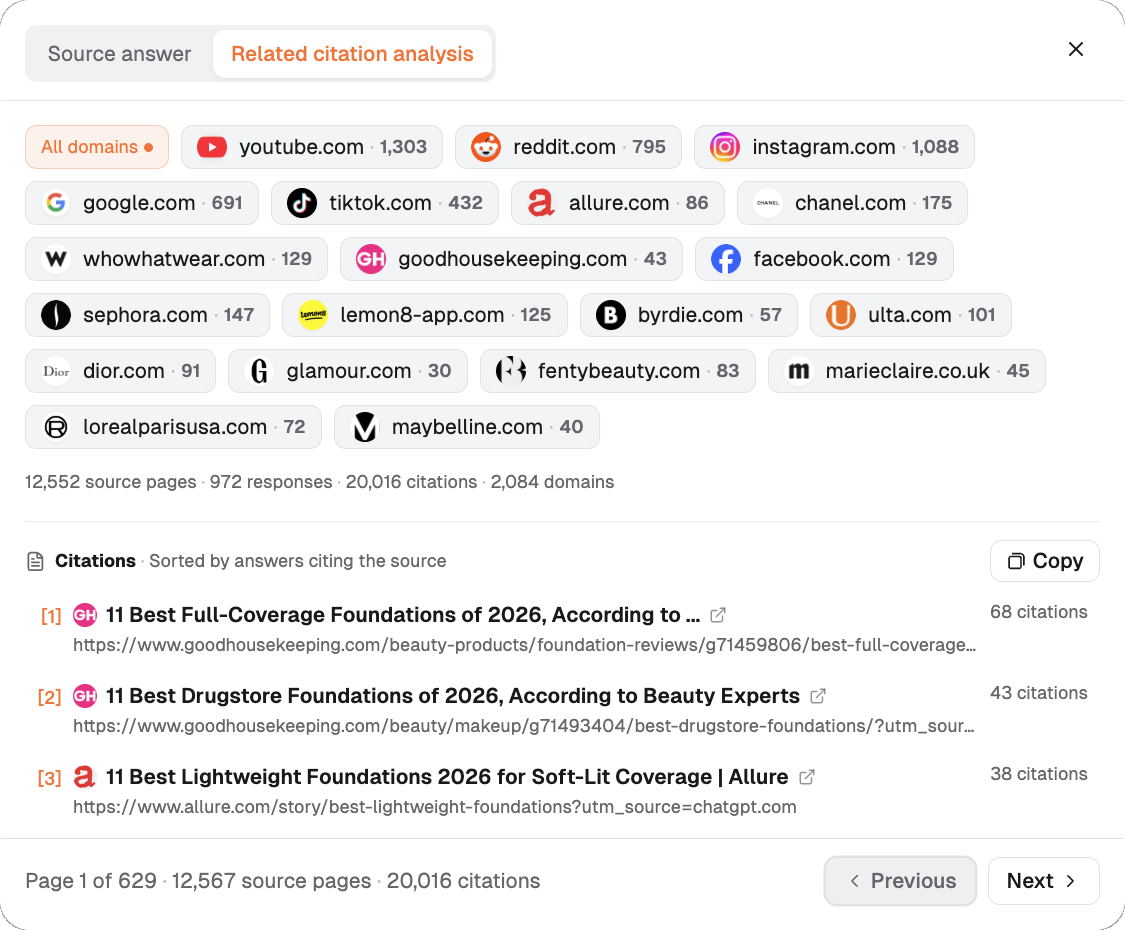
In this citation view, the Foundations market shows 972 responses, 20,016 citations, and 2,084 domains. Among the displayed domains, youtube.com appears most often in this view (1,303). This view is a way into the evidence behind an answer, rather than a substitute for reading that evidence.
When a ranking or attribute association raises a question, return to the original AI response and its cited pages. Check whether the recommendation rests on a brand page, review, video, or another source, and whether that material supports the claim. The answer and its sources give the finding its context.
Figure 10: Related citation analysis links market-level patterns to the sources cited in AI answers.
Look past the headline score
Estée Lauder's Foundations rank is meaningful, but each market view answers a different question. Reading segments, platforms, regions, intents, attributes, shopping results, and citations together shows where the ranking holds and where it needs explanation. Checking original responses turns those patterns into evidence for a decision. Without that step, a team is left with a few good-looking leaderboards and no clear next move.
This is why Dageno is building AI search market intelligence. GEO is the most visible use today, but the scope is wider. As AI takes on product discovery, comparison, recommendation, and parts of shopping and advertising, brands need a way to keep understanding the structure of that market: which needs AI answers, how it frames competition, which sources it relies on, and where products and ads appear. Teams that can keep seeing that structure have a better chance of turning scattered marketing actions into decisions backed by evidence.
The Estée Lauder Companies has started putting this into its global brand operations. Other brands do not need a full process in place to begin. Looking up your own market on Dageno is free: see where the brand stands today and who it competes with, then decide which question deserves the first deep dive.
See Where Your Brand Stands in AI Search, for Free
Dageno public market data, Foundations market (screenshots taken 2026-09-29): https://insight.dageno.ai/
About the Author
Updated by
Dageno
Dageno is the research and insights team at Dageno AI, publishing industry reports and expert analysis on AI Search Visibility, Generative Engine Optimization (GEO), and AI-powered search discovery.