In FTA Global’s test, an average of 2.9 of the top five AI-recommended brands changed outside a “New York + English” baseline. This article breaks down four ways AI buying questions differ across markets (where people ask, local constraints, cited sources and recommended brands) and gives a five-step method to compare them.
In this article, "AI buying questions" means the shopping, comparison and pricing questions people ask ChatGPT, Gemini, Google AI Mode and other AI tools.
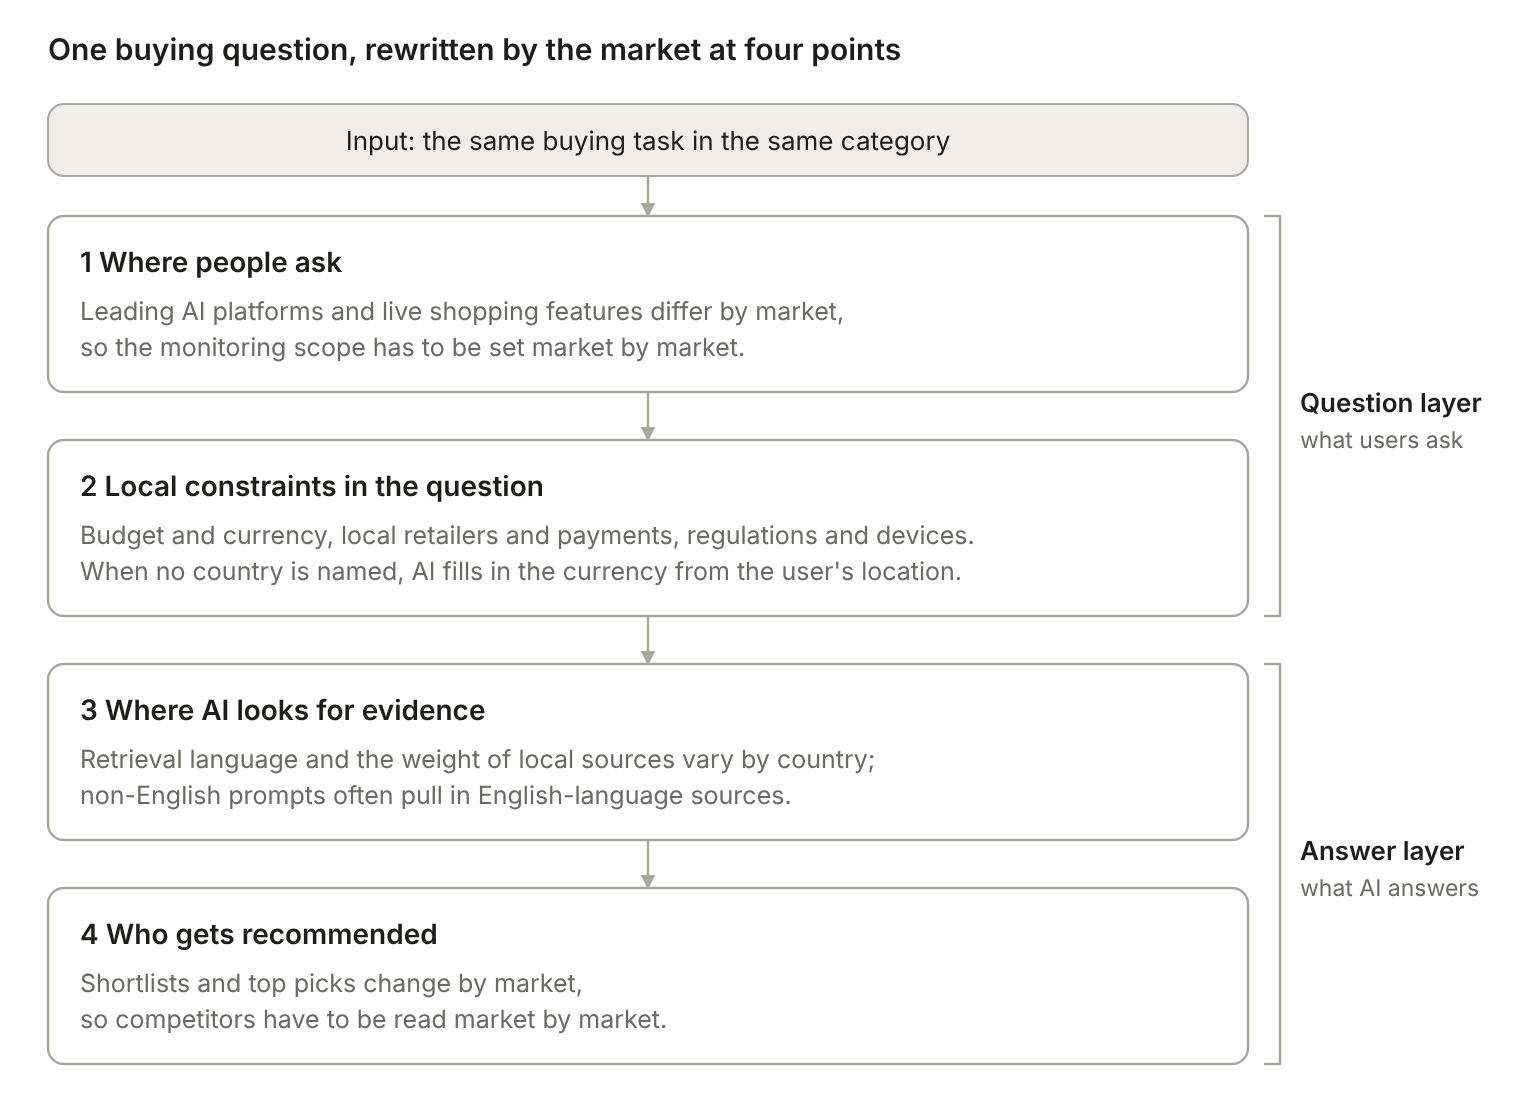
The same buying question in the same category changes in at least four ways when you move to another country, region or language market: which AI people ask, which local constraints the question carries, where the AI looks for evidence, and which brands it finally recommends.
Public tests show the gap is large. FTA Global tested 10 software categories on ChatGPT and Gemini: outside its "New York + English" baseline, an average of 2.9 of the top five recommended brands changed. In a separate five-language test, easyJet was the top pick in 72.5% of Russian-language answers but in only 12.5% of Persian-language answers.
One caveat up front (this is our judgment): most public research measures what answers the same question gets in different markets. Very little measures how people in different markets actually ask. That requires real question samples in the local language; translating English prompts will not give you that.
In practice, treat "country × language × platform" as one unit of comparison. Sample each unit repeatedly with a localized question set, then compare across four dimensions. When you see a difference, explain it first with local prices, availability and cited sources, and only then decide whether to change content.
Why AI Buying Questions in the Same Category Differ by Market
A "market" here is three variables stacked together: the user's country or region, the language of the question, and the AI platform. Change any one of them and the same buying question can get a different answer. The UK and the US share a language, while India mixes English, Hindi and Hinglish, so country and language need to be recorded separately.
Location alone can rewrite an answer. In a test published in October 2026, Massive sent ChatGPT the same prompt asking for "a typical price for a cup of coffee at a cafe" from the United States, Brazil and Japan at the same time. The prompt named no country. The US answer quoted dollars, while the Brazil and Japan answers added prices in reais and yen. Each country was run only once, so the test shows that the effect exists, not how often it occurs.
Keep two layers apart in your analysis. The question layer is what users asked and which conditions they attached. The answer layer is which sources the AI used and which brands it recommended. When a brand "disappears" in a market, local users may simply be asking a different question, or the AI's sources and preferences may have changed. The next four sections follow that order.
Four layers of difference, covered in the four sections below.
Difference 1: Which AI People Ask Varies by Market
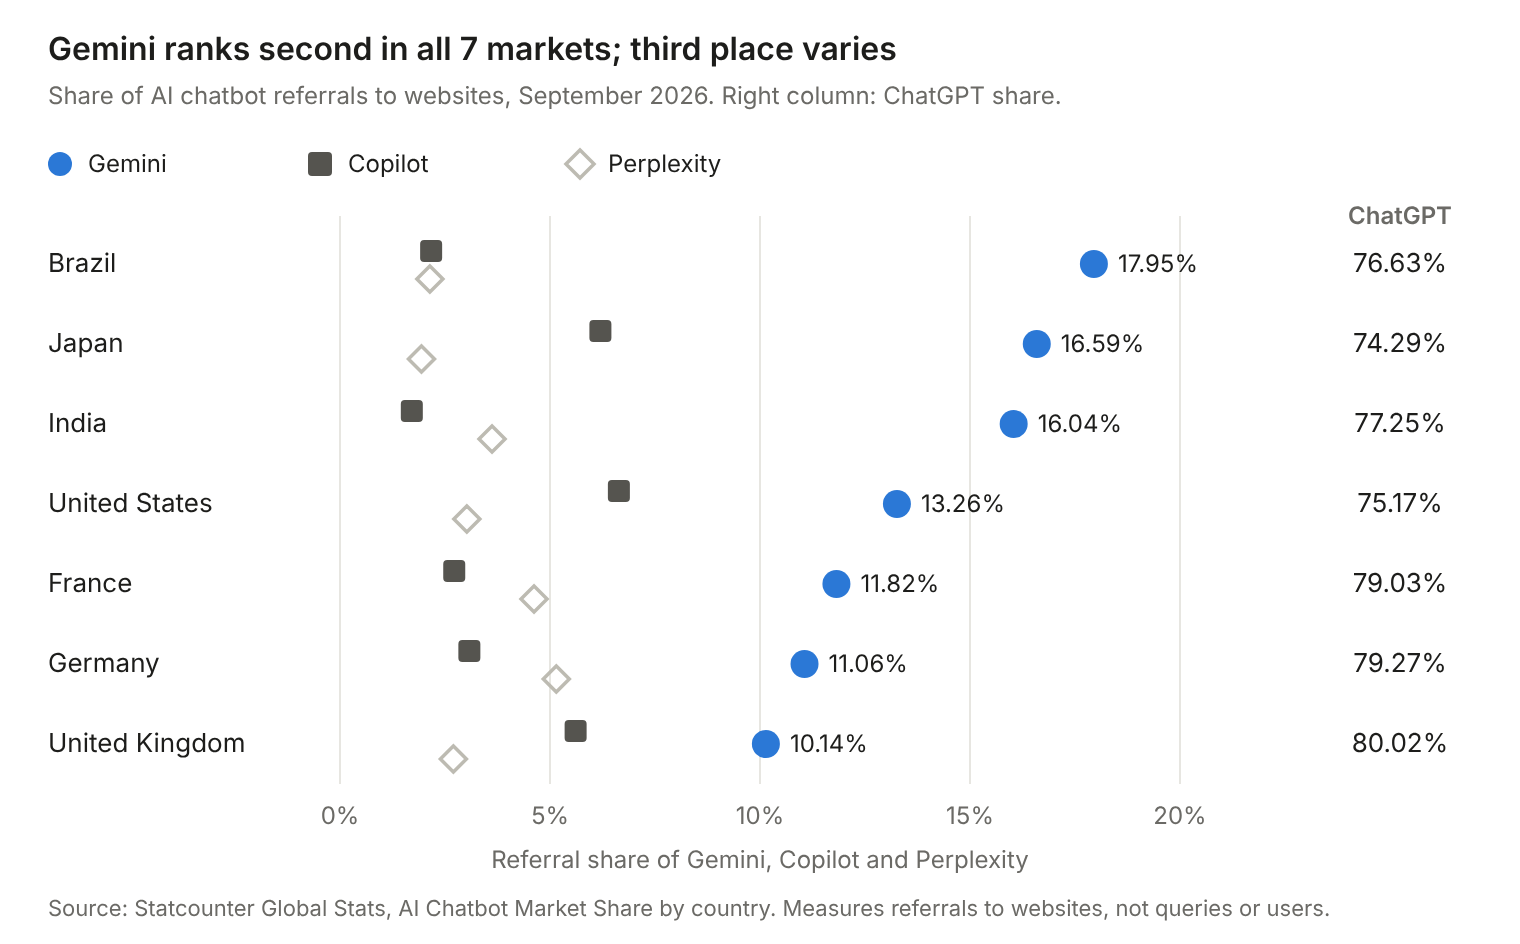
ChatGPT leads in every major overseas market, but the order behind it differs. Statcounter's September 2026 data puts ChatGPT at roughly 74%–80% in each of the seven markets below. Gemini is above 16% in Brazil, Japan and India but about 10% in the UK. Copilot is above 6% in the US and Japan but below 2% in India. Perplexity is higher in Germany and France than in the other markets shown.
Source: Statcounter Global Stats, AI chatbot referral share, September 2026, seven markets.
Mind the metric. Statcounter measures each chatbot's share of referrals to websites (based on page views on the sites it tracks). It is not a count of questions or users, and it excludes Grok, which does not pass referral data. It tells you which platforms send people to websites in a market; it cannot be used to estimate shopping question volume.
Survey data points the same way. A World Retail Congress survey commissioned by Vercel (May 2026, 4,000 European shoppers), as reported by Pygmalios, found that 49% of respondents in Southern Europe use ChatGPT when shopping, versus 40% in the Nordics, 38% in Germany and 33% in the UK. Half of UK respondents use no AI search at all when shopping, compared with 32% in Southern Europe. These figures are self-reported, Southern Europe and the Nordics are pooled multi-country groups, and Pygmalios itself cautions that "stated intentions routinely overstate observed behavior."
Feature rollout order also creates differences. When OpenAI launched Instant Checkout inside ChatGPT on September 29, 2025, it was open only to US users, and the only merchants were US Etsy sellers. A "buy it for me" request could be completed inside the chat in markets with checkout, but elsewhere it could only send users to an external site. We have not verified which markets the feature covers as of October 2026; check this separately before comparing markets.
Difference 2: Buying Questions Carry Different Local Constraints
Even when the question is "which one should I choose," each market attaches different conditions. Some are written into the question; others are filled in from the user's location.
Constraints written into the question: a budget in local currency, local retail platforms, payment and delivery options, local regulations or tax requirements. Payments are an obvious example. In FTA Global's test, Stripe ranked first in New York, London, Madrid, Paris and Berlin but did not make the top five in Mumbai, Delhi or Bengaluru. With a different local payments ecosystem, "which payment tool should a small business use" is effectively a different question.
Constraints filled in from location: even when the user names no country, the AI infers currency and rules from location, as the coffee test above shows. When comparing markets, record where every answer was collected.
How far along the purchase journey the question goes: in Deloitte's May 2026 survey of 13,500 consumers in 15 European countries, 42% of respondents in Spain were willing to let AI make purchase decisions for them, versus 27% in Finland. In markets where more people will hand the decision to AI, questions such as "just pick one for me" or "give me the best option" may be more common. This is a hypothesis to test against local question samples.
Not every need varies by market. In the World Retail Congress survey above, price comparison was the most common use among AI shoppers in every region (51%–55%). Our judgment: the action in a question is similar across markets, and the differences sit mainly in budget ranges, available channels and local rules. So when you organize questions, give budget and currency, named platforms, payment and delivery, regulations and device conditions their own columns.
Difference 3: AI Cites Different Sources, and Users Trust AI Differently
For buying questions in non-English markets, much of the evidence still comes from English-language web pages. Peec AI analyzed more than 10 million ChatGPT prompts and more than 20 million background searches (query fan-outs), keeping only sessions where the user's location matched the prompt language. Nearly 78% of non-English sessions added English-language research, and 43% of the fan-outs for non-English prompts were run in English. By language, Turkish sessions added English research most often (94%) and Spanish sessions least often (66%).
The weight of local sources also varies by country. In FTA Global's test, local domains and publications made up 42% of cited sources in Germany, 34% in France and 17% in India. Where local sources carry less weight, local brands may need coverage on English-language or international sites to enter answers. Peec AI's manual tests include one example: asked in Polish from a Polish IP address about the best auction sites, ChatGPT either left out Allegro, Poland's leading local platform, or buried it far down the list. This is a single example, not a statistical result.
Trust in AI answers differs too. In the same Deloitte survey, 61% of respondents in Spain said they trust information provided by AI, versus 36% in Finland. Our hypothesis: in lower-trust markets, users are more likely to follow up on sources, reviews and after-sales guarantees, so locally verifiable material matters more. No public data tests this directly yet.
Difference 4: Recommended Brands and Competitors Change
Stack the first three differences together and users end up seeing different shortlists. Using "New York + English" as the baseline, FTA Global repeated the same small-business buying questions in London, Madrid, Paris, Berlin and three Indian cities:
On average, 2.9 of the top five recommended brands changed.
The changes concentrated in categories tied to money and compliance: payroll, accounting, payments and HR averaged 4.4 changed brands, while project management, video conferencing and cloud storage averaged only 1.5.
Of 206 brands in total, 159 made the top five in only one location.
Language also changes the top pick. A test by Reza Moaiandin, co-founder of SALT.agency, published in Search Engine Journal, asked the same set of buying questions in English, Arabic, Russian, Simplified Chinese and Persian. The core test used Claude Sonnet 5 with web search off, collected on September 7, 2026, with 40 runs per scenario-language pair. The table shows the share of answers in which each brand was the top pick:
Scenario
Brand
Highest share
Lowest share
London–Tenerife return flight
easyJet
Russian 72.5%
Persian 12.5%
Noise-cancelling headphones under £400
Sony
Russian and Persian 100%
English 50%
CRM for a UK small business
HubSpot CRM
English 22.5%
Arabic 2.5%
Robot vacuum under £500
Roborock
Russian 97.5%
English and Arabic 87.5%
The robot vacuum row shows that not every category swings widely. In the same test, turning on web search for two of the categories changed the top pick in 7 of 10 category-language pairs. For those same two categories with search off, ChatGPT's top pick matched Claude's in only 1 of 10 pairs, and Gemini's in 5. The author notes that the data was collected in a single afternoon and that the results are directional.
Academic research observes a similar tendency. The EMNLP 2024 paper "Global is Good, Local is Bad?" found that LLMs more often associate positive attributes with global brands and disproportionately recommend luxury gifts to people in high-income countries, although country-of-origin effects may boost local brands in specific contexts. For brands, this means competitors are market-specific: the brands you go head to head with in the US may be replaced by a different set of local brands in India or Poland.
How to Compare Buying Questions Across Markets Systematically
Treat "country or region × language × platform" as the smallest unit of comparison and follow five steps.
Define the comparison units: record the country or region, language and platform for each unit. Split multilingual countries by language, for example English and Hindi in India, or English and French in Canada.
Build a localized question set: collect real phrasings from local sources such as local search suggestions, forums, and customer service and sales records, and have a native speaker review them. Keep one set of buying tasks shared across markets for comparison, then add questions unique to each market.
Fix the conditions and sample repeatedly: use the same time window, model and search settings, and repeat each condition several times. FTA Global ran each condition 5 times; the SALT test ran 40. Record the collection location and account state.
Compare across four dimensions: see the table below.
Explain differences with local facts: check local prices, availability, channels and regulations first, then decide whether to create localized content, update a shared page or keep observing.
Dimension
What to record for each market
Common misreading
Where people ask
Main local AI platforms; whether shopping cards, checkout and similar features are available
Testing only ChatGPT, only in US English
Question constraints
Original question text; budget and currency; platforms, payments, delivery, regulations and devices mentioned
Treating a translated English question as a local question
Evidence sources
Cited URLs, source language, local versus international sites
Counting domains without reading the sources
Recommendations
Top pick, top-five list, whether your brand appears and in what context
Letting one screenshot stand for a whole market
Comparing Buying Questions Across Overseas Markets with Dageno
The four dimensions above map onto several Dageno features:
Cross-Model and Regional Benchmarking: compares your brand's visibility, rank and leading competitors across AI models and regions, so an average does not hide where your position changes.
Regional Comparison: brings observable AI answers, competitive context and visible sources from different markets and languages into one reviewable view.
AI Search Intents: groups market prompts by intent; for each group you can check which brands the answers mention and which pages they cite.
If the goal is choosing the next market, the market expansion solution chains these modules into three checks: compare markets, understand each market, and choose what to check.
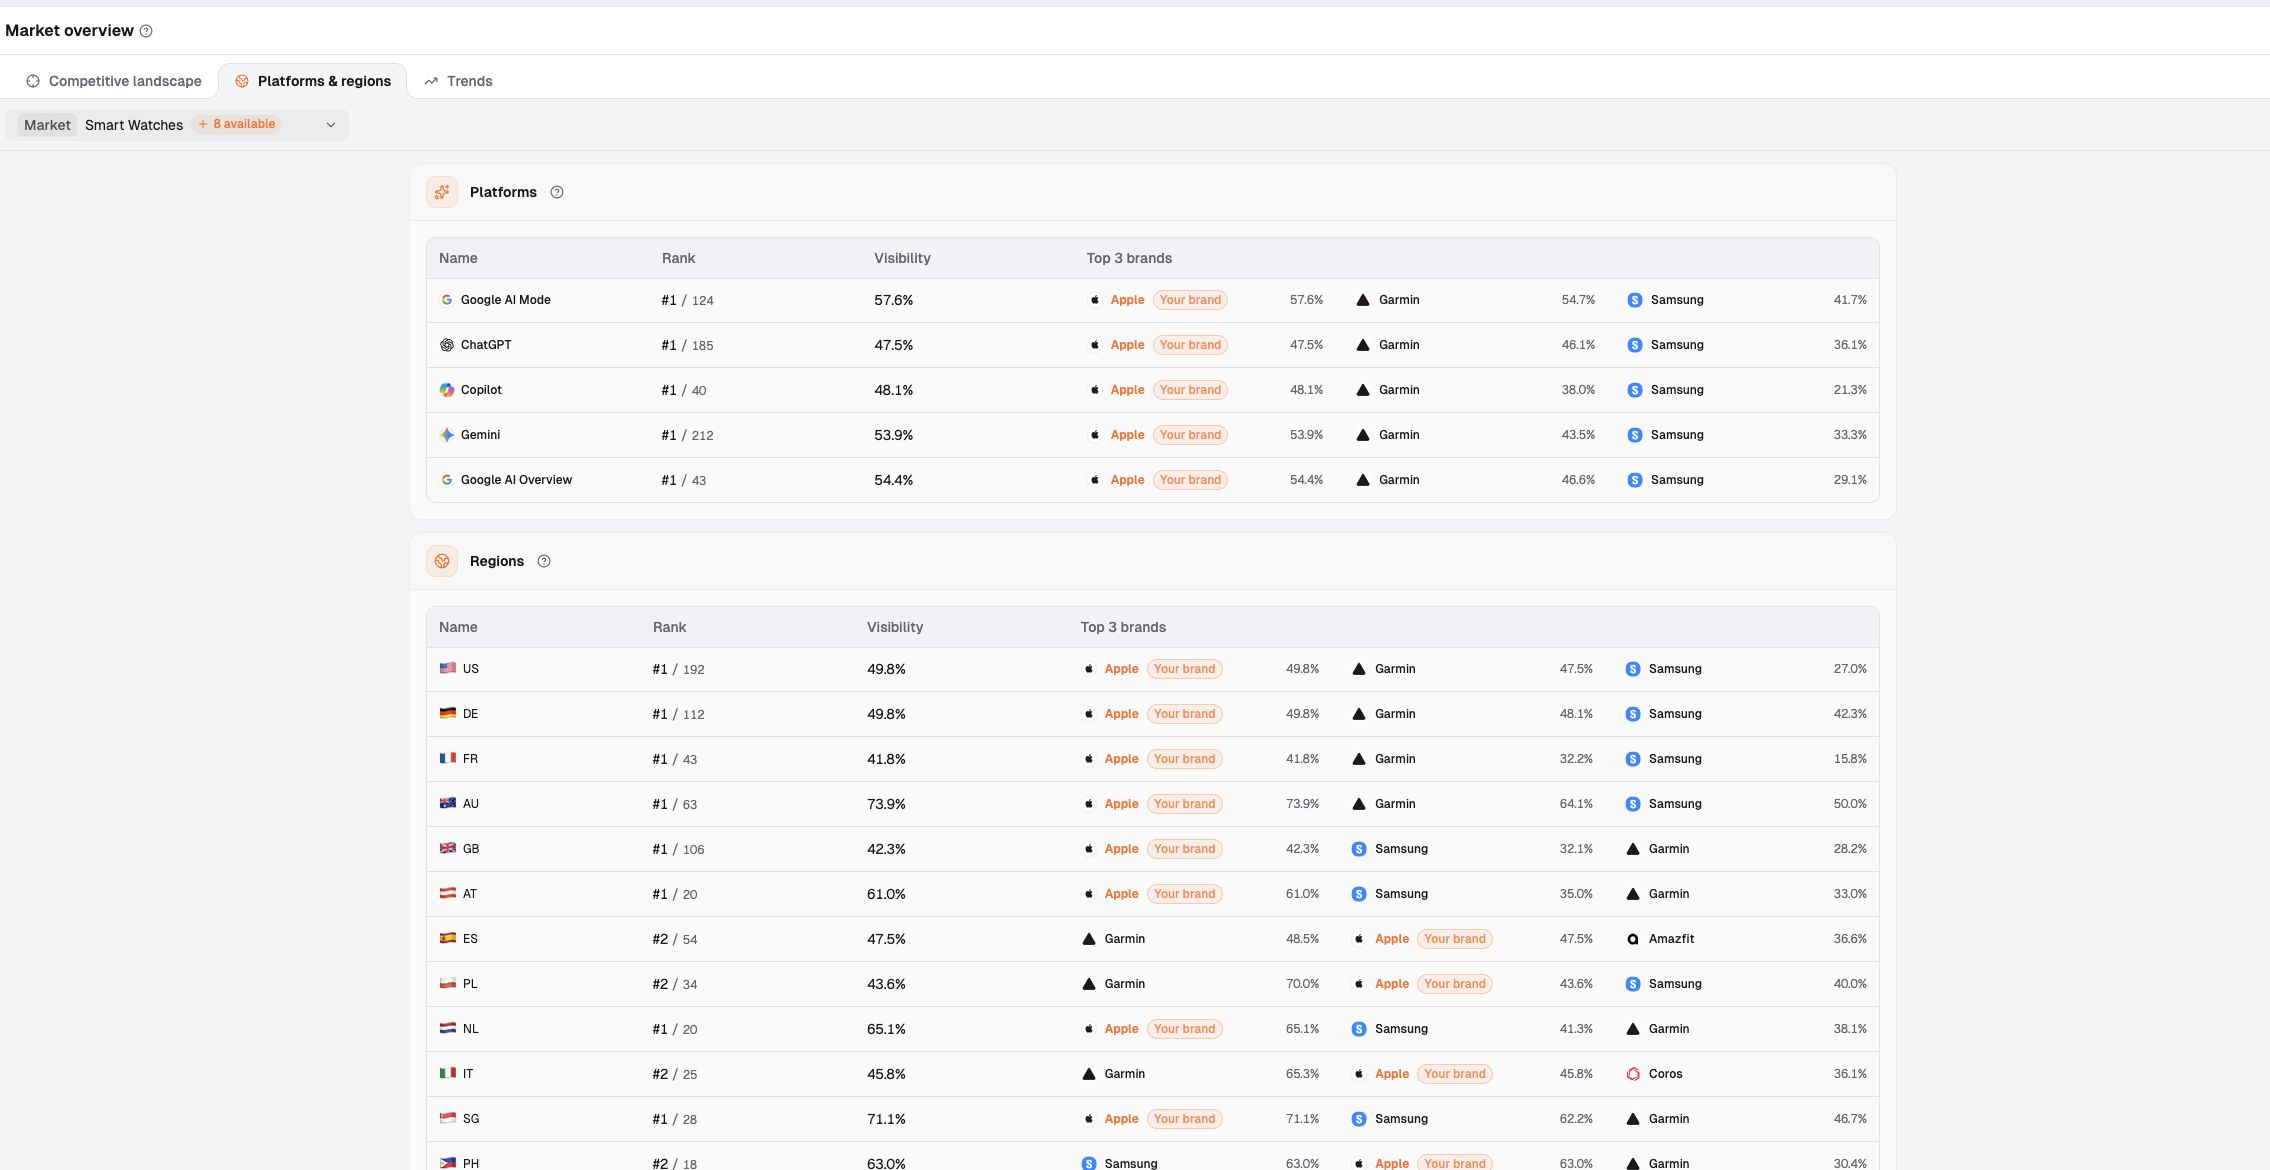
Take the smart watch market in a Dageno demo workspace as an example (Apple is only the example brand and is not a Dageno client). The regions table under "Market overview → Platforms & regions" shows Apple ranked #1 in most markets but #2 in Spain, Poland and Italy, where Garmin leads.
Figure 1: One smart watch market, with brand rank and visibility split by AI platform and region.
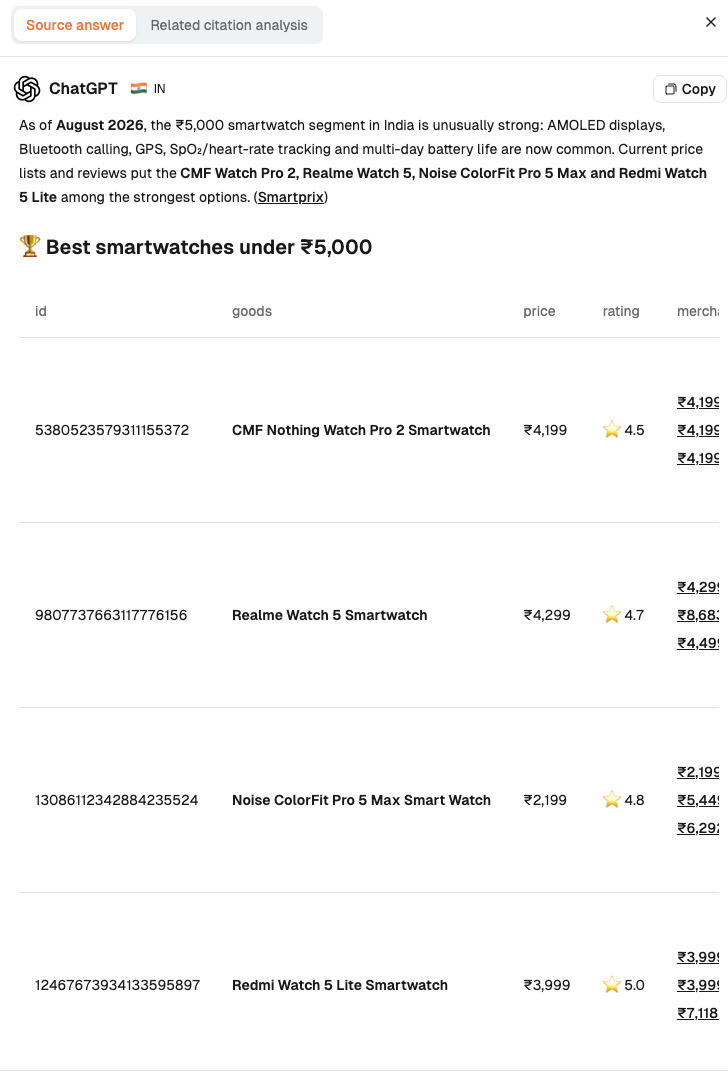
The regions table only tells you where to look first; you need to open the answers to see the questions themselves. In Dageno's published case study, AI Visibility by Region: When to Localize Pages, Apple ranks #14 in India with 4.76% visibility. Reading the answers shows that both Indian answers recommend watches under ₹5,000, while Apple's India site listed the Apple Watch SE 3 from ₹29,900 (checked on September 30, 2026, per the case study).
Figure 2: ChatGPT's answer for India (IN), with the question limited to under ₹5,000.
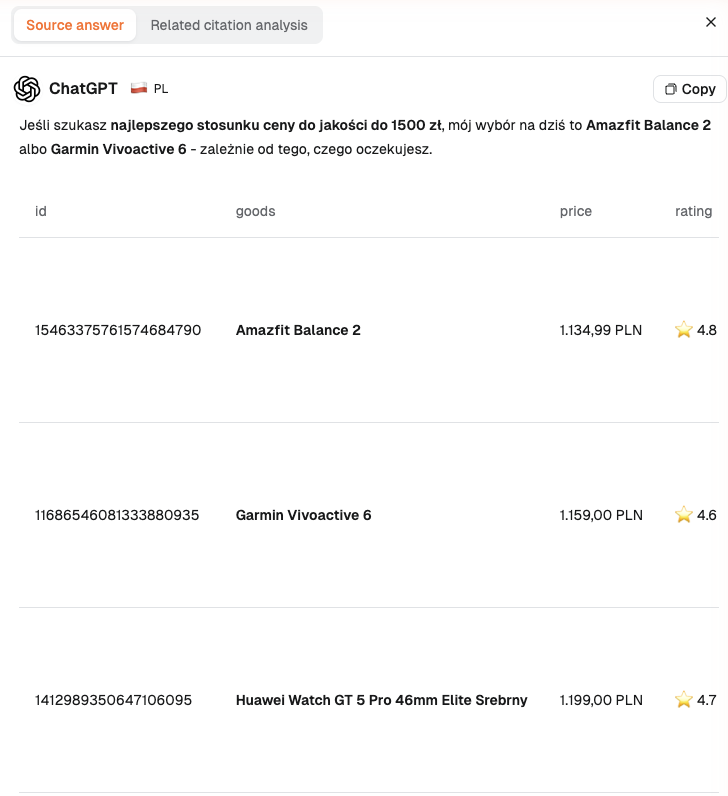
The Polish answer, by contrast, is in Polish with a 1500 zł budget. It recommends Amazfit, Garmin, Huawei, Samsung and other watches, and its citations come mainly from local retail and price-comparison sites such as euro.com.pl, ceneo.pl, mediamarkt.pl and allegro.pl.
Figure 3: ChatGPT's answer for Poland (PL), recommending watches in Polish within a 1500 zł budget.
These two markets match the two kinds of difference described above: in India the budget constraint in the question changed; in Poland the language and the local sources changed. The samples are small (two answers for India, only one comparable answer for Poland), so the case study concludes "mark as a non-target question" for India and "keep observing" for Poland.
These views record saved AI answers. As Dageno's market expansion page puts it, cross-market AI visibility "does not measure total demand, market size, sales potential, market share, or buyer preference." Choosing a market still requires first-party research plus product, channel and compliance review. According to the Dageno blog, the free lookup covers 86 countries and regions and 12,000 market segments, so you can start by checking where your brand stands in a target market.
Overlooked Variables, Biases and Costs
When comparing markets, the following factors are easy to mistake for "market differences," or can push the cost of comparison beyond expectations.
Location and language are two variables: FTA Global asked the same payments question in Mumbai in English, Hindi and Hinglish. All three returned mostly Indian brands, but the lists and their order changed. Changing only the IP without the language, or only the language without the location, measures different things.
Answers are unstable on their own: in FTA Global's test, all five runs named the same top brand in only 35% of conditions. A difference seen in a single run may just be random variation.
Platform, version and search settings: for the same city and question, ChatGPT and Gemini shared on average only 3.2 of their top five brands (FTA Global); in the SALT test, turning on search changed the top pick in 7 of 10 pairs. Do not pool results from different conditions.
Metrics differ: Statcounter measures website referrals, not usage. Consumer surveys are self-reported, and some report single countries while others pool several. In the Deloitte report, a few countries' AI usage rates differ slightly between the chart and the appendix table, so check the original table before citing.
The researchers' position: Peec AI, FTA Global and SALT.agency, all cited here, sell GEO or AI visibility services, and so does Dageno. Their conclusions point the same way, but their samples and methods differ; it is best to re-test with your own categories and markets.
Cost grows with the number of combinations: every additional "country × language × platform" combination adds sampling and answer-reading work, and local question sets need native-speaker review. Going deep on the 2–3 markets that matter most to the business is more practical than spreading across a dozen at once.
Time changes conclusions: platform features roll out market by market and models keep updating. Date every comparison, and do not compare old results directly with new ones.
Compare your brand's AI search visibility across markets
Does translating English questions into the local language represent local users' questions?
Only as "the same task asked in the local language." It does not capture local budgets, channels or everyday phrasing. Translated questions work as a cross-market control set; add native phrasings from local search suggestions, forums and customer service records.
How many languages should we test in one country?
Follow the languages local buyers actually use. In multilingual markets such as India, Switzerland and Canada, test at least the main languages separately. If some of your buyers ask in English (for example, multinational procurement teams), record English phrasings separately too.
How many answers per market are enough?
There is no universal number. In public tests, FTA Global ran each condition 5 times and SALT ran 40. Our recommendation: do not draw market conclusions until the top pick is stable across repeated runs, and sample more in volatile categories.
Is monitoring ChatGPT alone enough?
Not for most markets. ChatGPT has the largest referral share, but Gemini exceeds 16% in some markets, and ChatGPT and Gemini share on average only 3.2 of their top five brands for the same question. At minimum, add the second- and third-largest platforms in each market.
If one market shows different recommendations, should we build a localized page right away?
No. First check whether the question itself is different, for example a budget below your product line. Then check whether the product is sold locally and what local sources say. A localized page is worth it only when local facts genuinely differ and repeated sampling keeps showing your brand missing.
Conclusion
AI buying questions in different overseas markets differ at four layers: which platform people ask, which constraints the question carries, where the AI gets its evidence, and whom it finally recommends. Public tests already show that looking only at US English results can mislead you on more than half the shortlist (in FTA Global's software-category test, an average of 2.9 of the top five changed). Public data on how local users actually ask is still scarce, though, so every brand needs to sample its own markets and categories.
Dageno is the research and insights team at Dageno AI, publishing industry reports and expert analysis on AI Search Visibility, Generative Engine Optimization (GEO), and AI-powered search discovery.