Does Busy AI Answer Activity Mean Big Market Demand? What Other Evidence You Need to Cross-Check It
Busy AI answers don't mean big market demand. Answer counts follow your question set and sampling, and AI likes to list brands. Learn which layers of data to cross-check, and which signals justify a project versus a research lead.
Not necessarily, and most of the time it doesn't. “Busy AI answers” usually mix five signals: rich answers, high prompt volume estimates, answers that change every time, brands mentioned again and again, and AI ads or shopping cards.
The first three mainly reflect how much content exists online, how the estimate was made, and the randomness of the model. The fourth only shows that a brand made it onto AI's shortlist. The fifth shows that someone is willing to pay for these questions. It is the closest to commercial demand, but it still does not equal market size.
To judge whether demand is big, you ultimately have to go back to search data, behavior on your own site, and real customers.
The short answer: activity is “how much AI can say”; demand is “how many people want to buy”
An AI answer is the output for one question. If you ask ChatGPT “Which smartwatches are good for swimming?” and it gives you a long list, that only proves it can answer. The only person asking may be you.
Separate the two kinds of signals and the picture becomes much clearer:
Supply-side signals: how rich an AI answer can be depends on how much usable content exists on public web pages, reviews, and forums.
Demand-side signals: how many real users are asking, whether their questions relate to buying, and whether they take further action afterward.
The problem is that the demand side is almost invisible. No major AI platform publishes its prompt logs, and both Ahrefs and Conductor acknowledge this when explaining their methods. So every demand-side number on the market is an estimate or an indirect observation.
Below, we take the signals one at a time and look at what each one can prove.
Five “activity” signals and what each one tells you
These five signals are often lumped together as “this market is hot in AI.” The table separates them. The further down the table, the closer the signal is to “someone is paying.”
Signal
What you see
What it mainly reflects
What it can show
What it can't show
1. Rich answers
Long answers that list many brands and cite many sources
How much public content exists; how mature the category is
AI has enough material to discuss the category
How many people are asking
2. High prompt volume
A tool shows a topic is “asked a lot”
An estimate projected from panels or search data
How popular topics are relative to each other within the same tool
The absolute number of prompts; purchase intent
3. Volatile answers
The same question returns different brands in a different order each time
Probabilistic generation; the size of the candidate pool
Whether the category's candidate pool is wide or narrow
That the market is changing
4. Frequent brand mentions
Some brands appear again and again across many answers
The brand's position in AI's candidate set
The brand's visibility within the chosen question set
Sales, market share, clicks
5. AI ads, shopping cards
Sponsored ads or product cards appear below the answer
Advertisers paying; the platform judging there is shopping intent
Companies are willing to buy exposure for these questions
Market size, conversion rate
Signal 1: Richer answers usually mean more “material to talk about”
Long answers that list many brands first tell you there is a lot of content about the category online, not that many people are asking.
A study published by SparkToro and Gumshoe in January 2026 supports this. 600 volunteers used 12 prompts and collected 2,961 answers from ChatGPT, Claude, and Google AI. The researchers found that the number of brands AI recommended varied widely from topic to topic, and that this variation closely tracked how many entities exist for that topic in the material AI learns from. For example, Los Angeles has fewer than a dozen Volvo dealerships, while recent science fiction novels number in the thousands.
From this we can infer (this is our judgment, not the study's conclusion): for a consumer category with many reviews and ranking lists, AI will answer in confident detail. For an industrial category with strong purchasing demand but little public content, AI may give only a few lines. How rich an answer is has no necessary link to how big demand is.
How to check: open the citation sources behind the answer and sort them into brand websites, editorial media, community forums, and e-commerce platforms. If the citations are concentrated on a few ranking or affiliate sites, “rich” only means those sites write a lot.
Signal 2: When prompt volume is high, first ask “where does this number come from?”
Prompt volume (also called AI search volume) is the metric that looks most like “demand data” today, but it is entirely estimated. When you get a number, first find out which estimation method it comes from:
Consumer panels and browser extensions: collect real prompts from participants who opted in, then extrapolate to the whole population. The upside is that you see real wording. The downside is a small sample that skews toward desktop and tech-savvy users. For reference, OpenAI told Axios in July 2025 that ChatGPT receives about 2.5 billion prompts a day, about 330 million of them from the U.S. (TechCrunch). Conductor estimates that panels cover less than 1% of the total, with some estimates as low as 0.15%. Note that this is an estimate from a competing vendor, not an independent statistic.
Projections anchored on Google search data: for example, Ahrefs' AI adjusted volume starts from traditional search volume and converts it. Ahrefs' reasoning is that AI prompts are long and one prompt often covers several topics, so simply adding up the counts for each topic in clickstream data inflates the number. The trade-off is that what it measures is still essentially demand on Google.
First-party data: referral visits from chatgpt.com and perplexity.ai in your own GA4, plus queries in Search Console. These are real counts, but they only cover the demand that has already reached your website.
You also need to check whether these prompts have anything to do with buying. An NBER working paper written by OpenAI with Harvard economist David Deming analyzed 1.5 million ChatGPT conversations. According to Deming's summary, non-work messages made up 73% by mid-2025. “Seeking Information” (including looking up products to buy and recipes) accounted for 21.3% of all messages, below “Practical Guidance” at 28.3% and “Writing” at 28.1%.
This means (our inference): a large share of a topic's prompt volume may come from homework, copywriting, and learning, with nothing to do with buying. High prompt volume shows at most that “people talk about this topic.” It cannot show that “people want to buy.”
How we suggest using it: compare the relative level and trend of topics only within the same tool, and don't compare absolute values across tools. Look at it alongside Google search volume and Google Trends; it is more credible when they point the same way. In internal reports, talk about trends, not precise numbers.
Signal 3: Answers that change every time don't mean the market is changing
If the same question gets a different answer today than last week, the most common reason is too small a sample, not a changed market.
The SparkToro study mentioned above gives concrete numbers: if you ask the same prompt 100 times, the chance that ChatGPT or Google AI returns exactly the same brand list is under 1%. The chance of the same list in the same order is even lower, about 1 in 1,000. Real users' wording is just as scattered: when 142 participants each wrote a prompt for the same intent, the average semantic similarity was only 0.081.
The study has another side too. With repeated sampling, a brand's appearance rate is relatively stable, and the researchers consider it a reasonable metric. “What rank you hold in AI,” by contrast, is meaningless.
How to check: first fix the market, language, model, question set, and time window, then sample several times and compare appearance rates, not two screenshots. Only changes measured under the same settings are worth following up as market signals.
Signal 4: Frequent brand mentions mean a brand is on the shortlist, not that it sells well
When a brand appears again and again in AI answers, it has made it into the model's candidate set. That is a different thing from sales or market share.
The same goes for breaking results down by purchase intent: if one type of question makes up a large share of the tracked question set, that tells you which direction your content should take, not how many people are buying.
Even being mentioned does not necessarily bring visits. Pew Research Center analyzed real browsing data from 900 U.S. adults in March 2025, covering 68,879 Google searches. When an AI summary appeared on the page, users clicked a traditional result 8% of the time, compared with 15% when there was no summary. Only 1% clicked a link cited inside the summary. These are Google Search figures and can't be applied directly to ChatGPT, but they are enough to show a clear gap between “being shown by AI” and “bringing visits.”
Signal 5: AI ads and shopping cards are the closest signal to “willing to pay”
The first four signals are all generated by AI itself. Ads are different: they are votes companies cast with their budgets.
According to OpenAI's official announcement, ChatGPT began testing ads on February 9, 2026, for logged-in adult users on the Free and Go plans in the U.S. In March, OpenAI announced it would expand the pilot to Canada, Australia, and New Zealand. In August, it announced that ads had launched in the UK, Mexico, Brazil, Japan, and South Korea. Ads are labeled Sponsored, shown separately from the answer, and matched by conversation topic, past chats, and ad interactions. OpenAI says ads do not affect answers and do not appear next to topics such as health, mental health, or politics.
Why this is closer to demand (our judgment): if advertisers are willing to buy exposure on questions like “how to choose a living-room TV,” at least some companies believe there are buyers there. That is far more convincing than “AI answers in a lot of detail.”
Three variables to watch:
Limited coverage: ads are live only in some countries and for some user tiers, and sensitive categories are excluded. Not seeing ads may only mean the platform hasn't opened them there, not that there is no demand.
Testing is not the same as paying off: early advertisers may just be testing. Ads that keep running say more.
Regional mismatch: ads appearing in the U.S. do not mean your target market has the same demand.
Shopping cards are another clue: when a platform treats a question as a shopping question, it usually shows product cards. Which questions trigger product cards, and which competitors take those spots, is also worth recording.
Turning “activity” into “demand”: a five-level evidence ladder
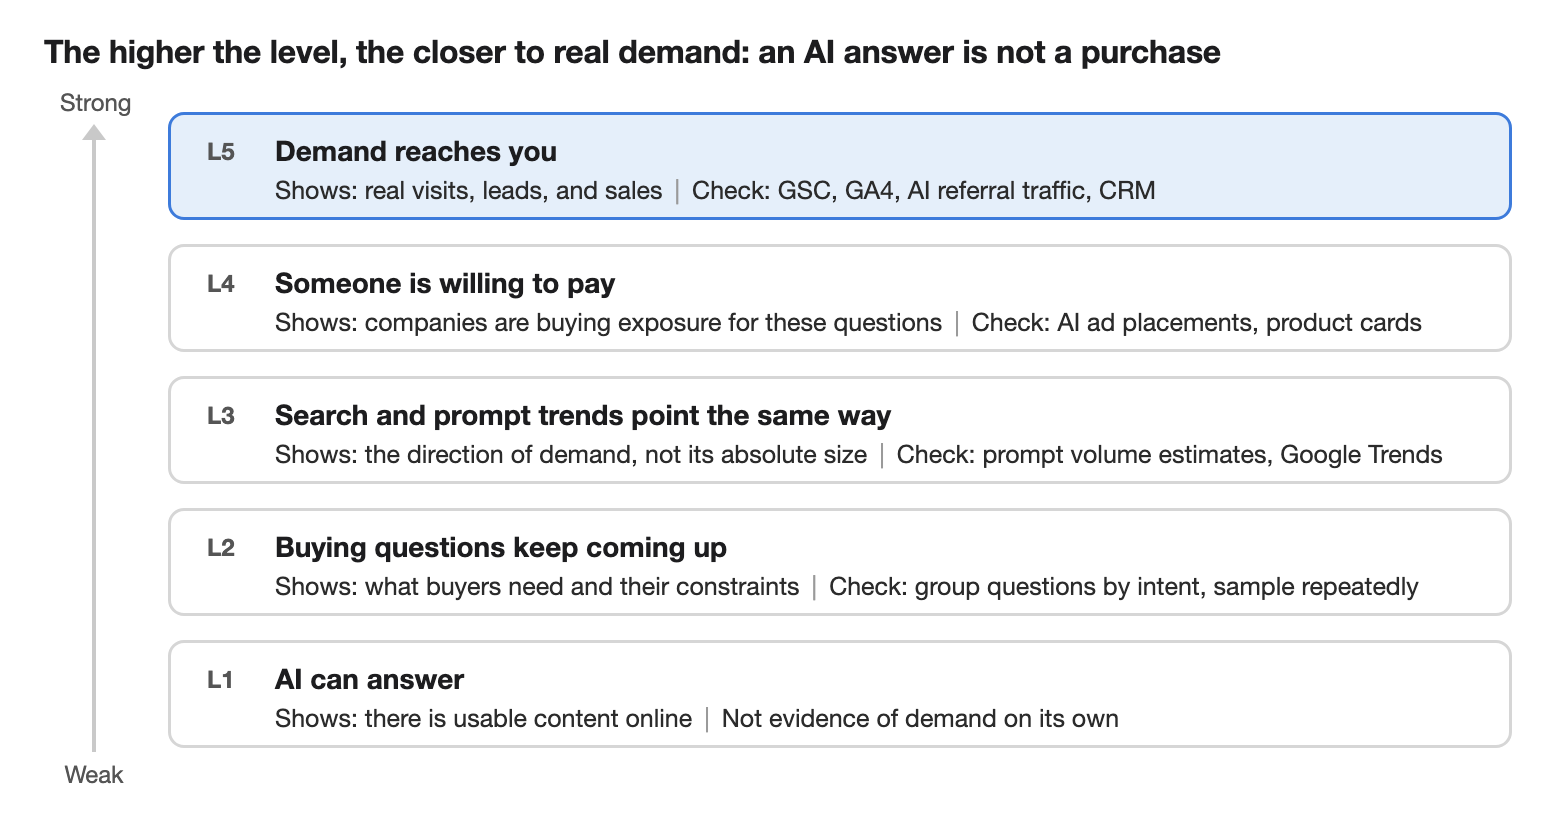
The five signals can be arranged as a ladder. Look for evidence from the bottom up: no amount of low-level signals can replace higher-level evidence.
Evidence ladder: five levels, from “AI can answer” to “demand reaches you”
For a piece of content, reaching L2–L3 is usually enough. To decide whether to enter a new market, you must reach L5. Not every category has L4, and no ads does not mean no demand.
Five checks: turn an “AI is busy” observation into a judgment others can verify
The order below starts with the cheapest checks. The further you go, the closer you get to real demand.
Name which kind of “activity” it is. Compare it against the five signals above and put the observation into one of them. Don't stack different kinds of signals into one “heat score.”
Fix the settings and sample repeatedly. Set the market, language, AI platform, question set, and time window. Ask each question several times and look at the appearance rate, not a single screenshot. Include real customers' own words in the question set.
Separate the intents. Group the questions into learning, comparing, and buying, and see which group the activity concentrates in. Many learning questions point to a content opportunity; only many buying questions get closer to commercial demand.
Look for evidence of paying. For the same set of questions, check whether there are advertisers and product cards, and which competitors are running them.
Go back to first-party data and search data. Use Search Console to check impressions and clicks for related queries, GA4 to check AI referral visits and key events, and Google Trends to see whether traditional search demand moves in the same direction.
Use Dageno to run these checks the same way every time
The five checks above are not hard to do by hand once. The hard part is keeping the settings consistent every time and being able to look back at the evidence. Dageno's Market Intelligence records AI answers, citation sources, purchase intents, ads, and product cards within the same market, model, region, and time range, which maps directly to L1 through L4 of the evidence ladder. Below, we use the Smart Watches market as an example.
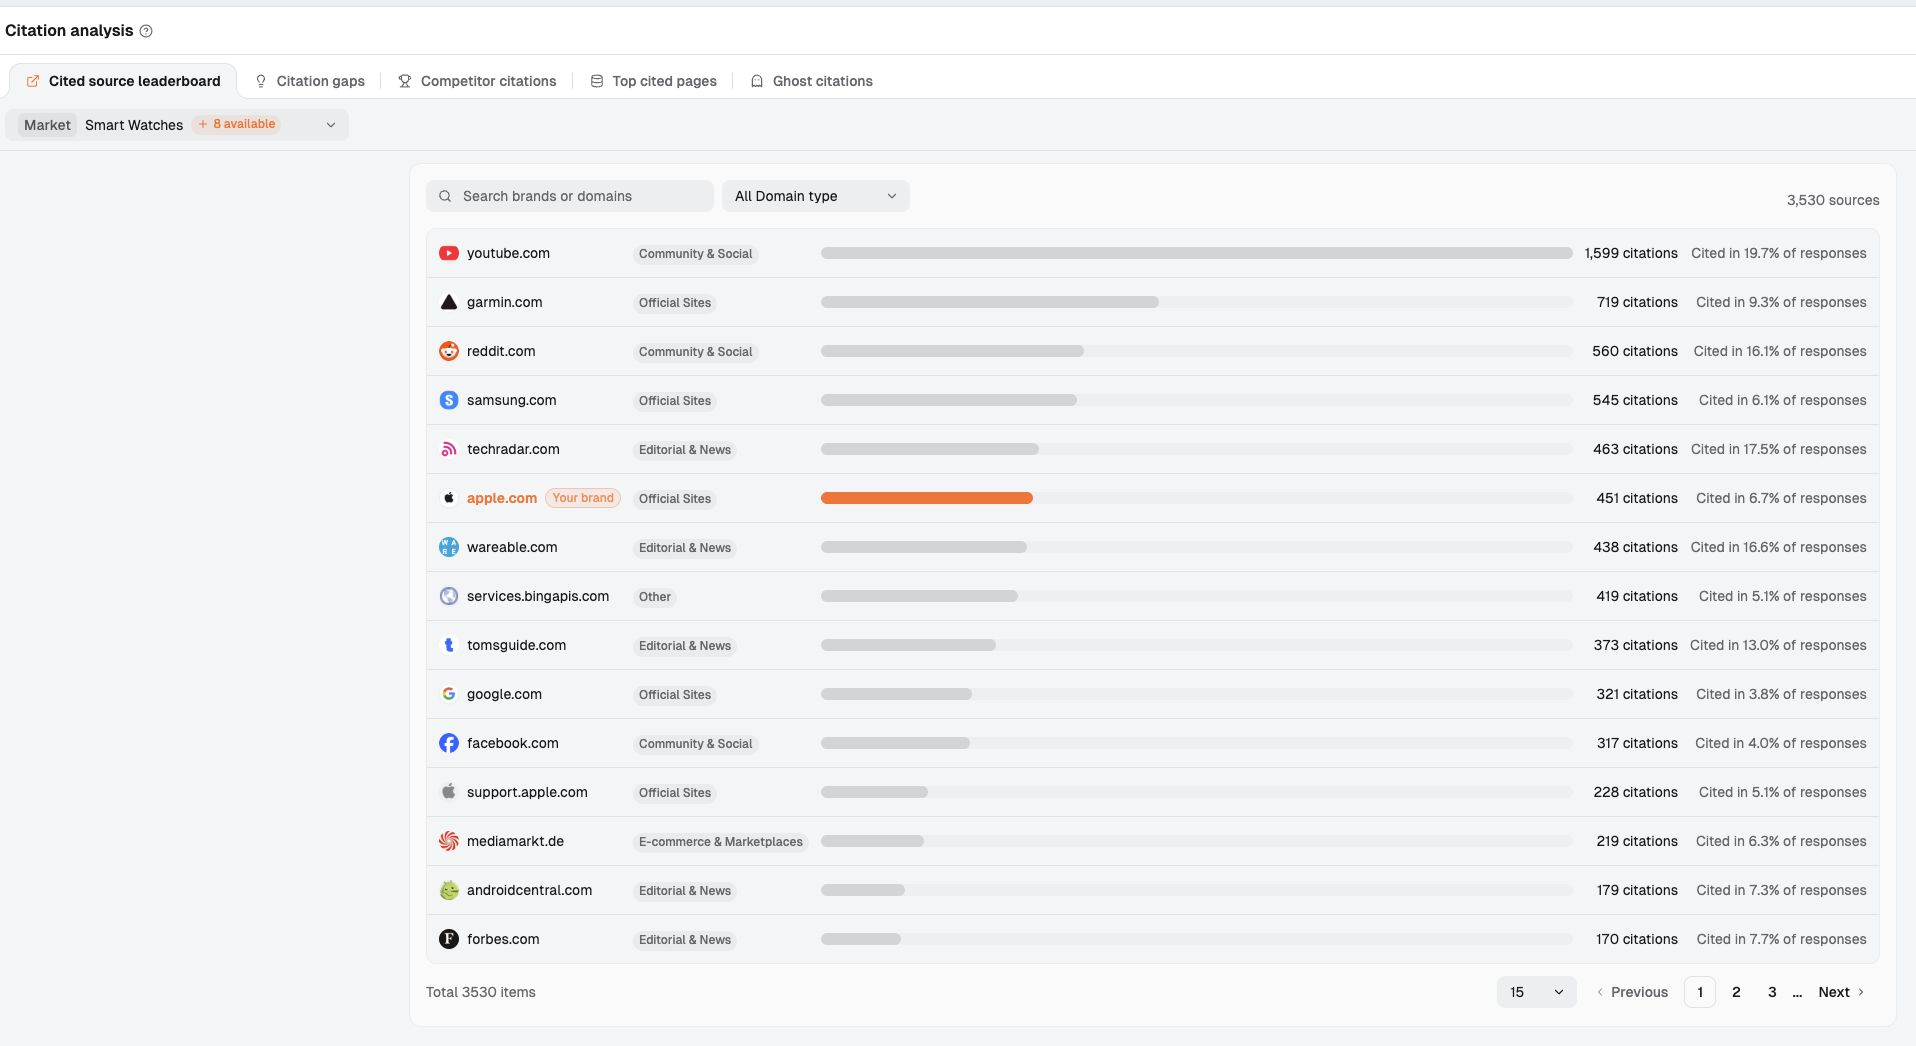
See whose content the answers rely on.AI citation sources and content lists cited domains, citation counts, and the share of responses that cite each one, and labels each domain by type, such as Official Sites, Editorial & News, and Community & Social. In Figure 1, youtube.com is cited in 19.7% of responses, and apple.com ranks 6th at 6.7%. Answers in this category are rich mainly because community and media content supports them.
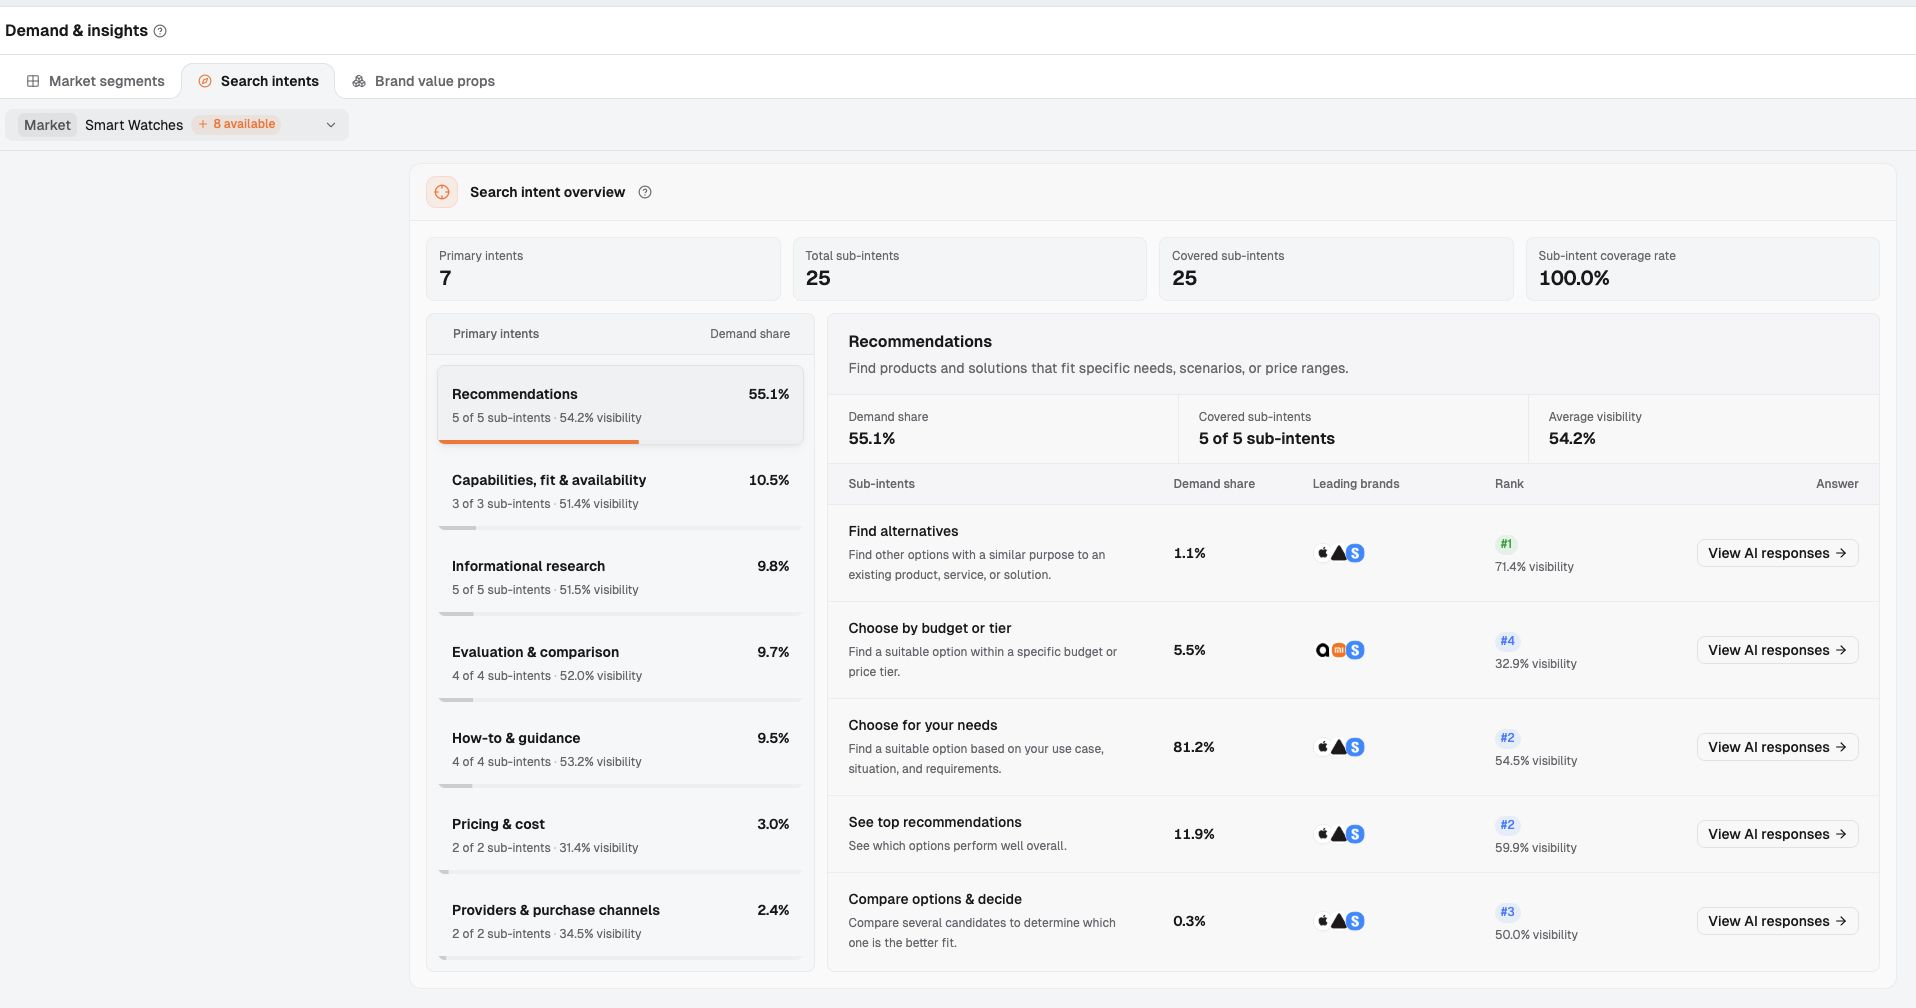
See which questions the activity concentrates on.AI Search Intents groups questions by purchase intent. In Figure 2, “Recommendations” has a 55.1% demand share. Within it, “Choose for your needs” accounts for 81.2%, while “Compare options & decide” accounts for only 0.3%. This suggests content should be organized around use cases. Demand share describes the tracked questions, not search volume.
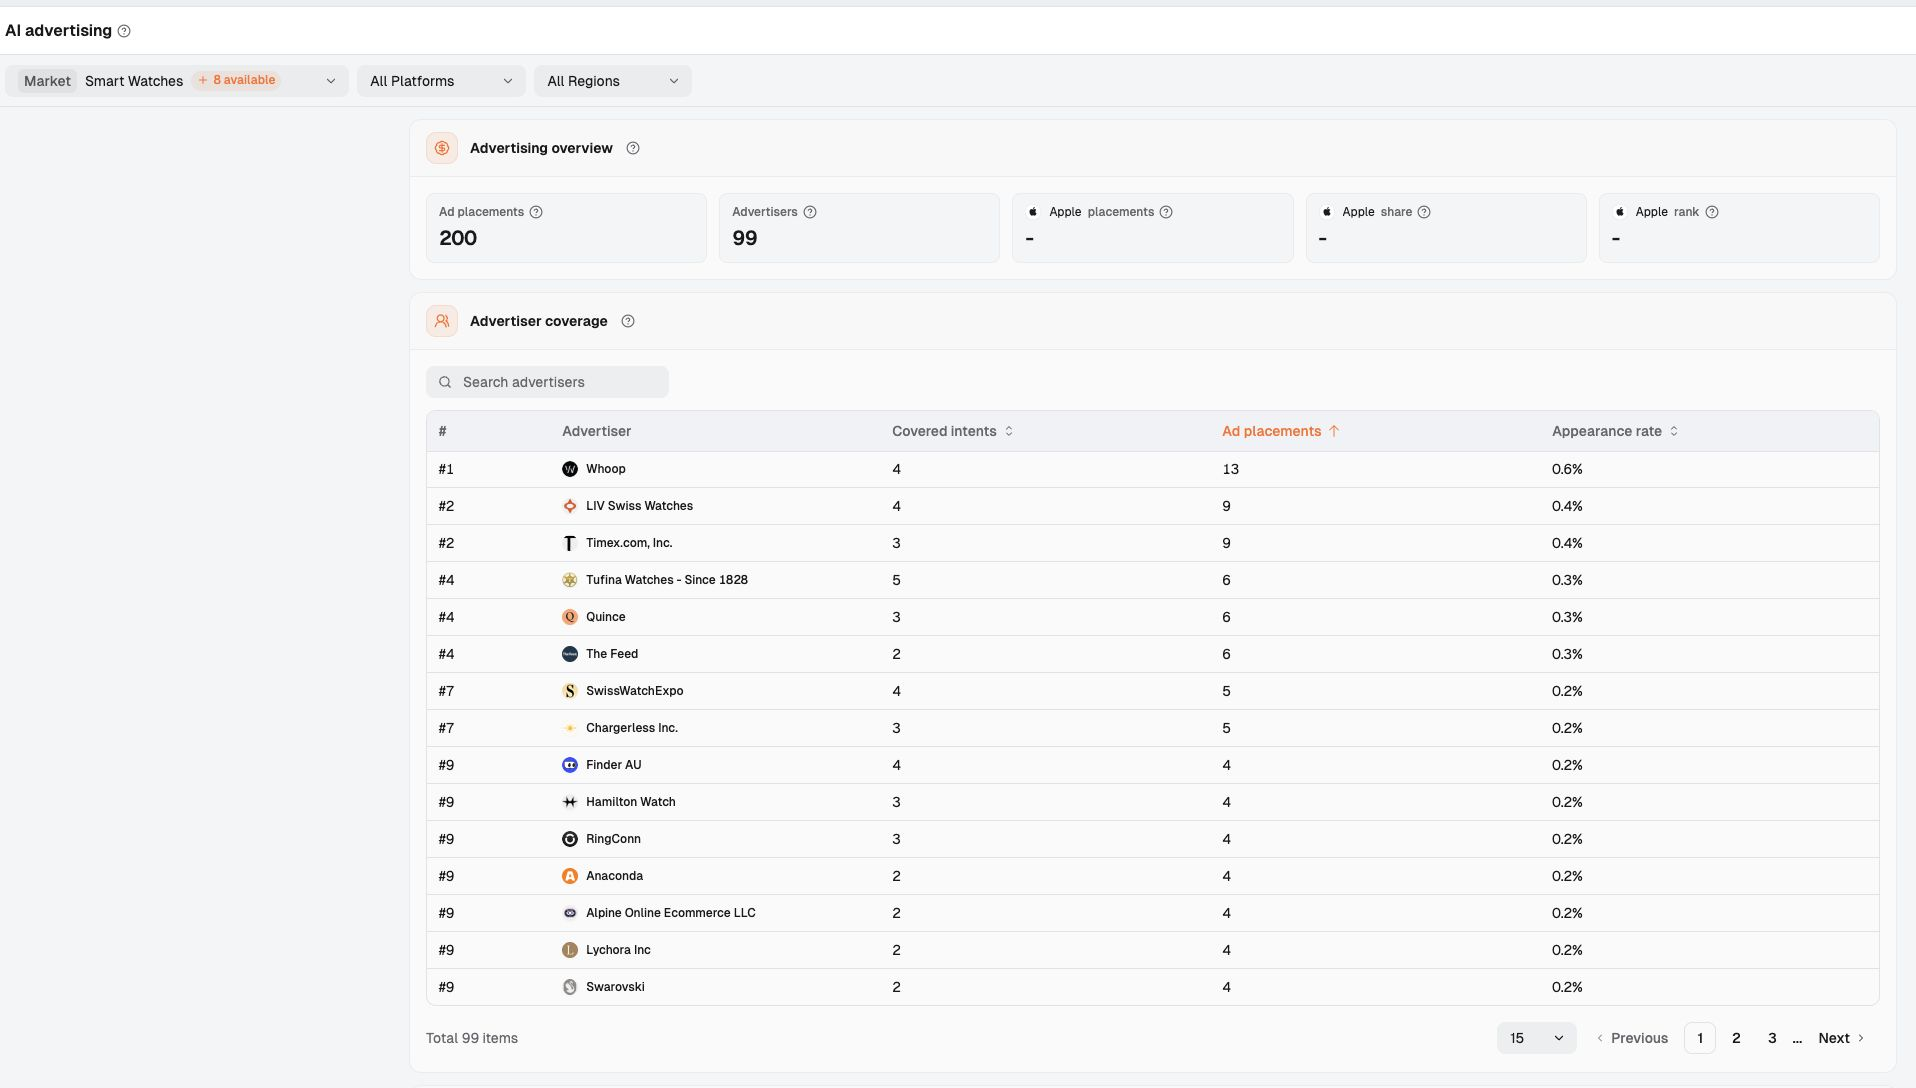
See whether anyone is paying.AI Advertising Competition records the advertisers and ad placements observed in ChatGPT Ads and Google AI Overview Ads, and AI Shopping Product Visibility records the products, prices, and merchants in product cards. In Figure 3, across all platforms and all regions, this market has 200 ad placements and 99 advertisers. Whoop appears most often, with 13 ad placements. The number of ad placements does not represent spend or conversions.
Then add prompt popularity and your own data.Prompt Volumes prioritizes topics under the same settings, and Cross-Model and Regional Benchmarking compares differences across models, countries, and languages. After you connect GSC and GA4, your own queries, landing pages, and key events appear side by side with AI data, each keeping its data source label. This fills in L5.
If your team is short on people, Dageno also offers a GEO/AEO managed service covering diagnosis, content, sources, and ongoing delivery. To be clear, Dageno does not estimate market size or total demand (see the market entry research page). It makes every level of evidence reviewable and verifiable. Investment decisions still need first-party data and customer research.
Often-overlooked variables, biases, and costs
The same “activity” can lead to opposite conclusions under different settings. Before you act, go through these:
Asker bias: prompts written by you or a tool are not user logs. Asking with your own category terms already pushes the answer toward “there is demand.”
Platform bias: which AI assistant users in your target market mainly use needs to be confirmed separately. Activity on ChatGPT does not mean other platforms are just as active.
Region and device bias: Conductor points out that browser-extension data barely covers mobile and enterprise users. Rich answers in English do not mean the Chinese or Japanese market is the same.
Time bias: model updates and changes in web retrieval sources both change answers. Comparisons across periods must use the same settings.
Usage bias: AI use is mostly non-work and non-shopping (see Signal 2), so high prompt volume may come from writing and learning.
Cost of verification: repeated sampling, cross-platform comparison, and connecting first-party data all take people and tools. Match the effort to the size of the decision: for one piece of content, relative popularity is enough; to enter a new market, you must go all the way to first-party data and customer interviews.
If AI answers questions about a category in great detail, does that mean the category is popular?
No. How rich the answers are depends mainly on how much usable content exists online. To judge popularity, at least look at relative changes in search volume or prompt volume estimates, and ideally your own site data too.
Which is more reliable, prompt volume or Google search volume?
Google search volume is built on Google's own data, so the way it is measured is much more stable. Prompt volume is always an estimate and is suited to comparing how topics rank relative to each other. When the two point the same way, the result is more credible. When they clearly diverge, the reason is worth investigating on its own.
If prompt volume is very low, is there no point doing GEO?
Not necessarily. Estimation methods may undercount some groups, such as mobile and enterprise users. If your target buyers use AI to choose products and competitors already appear in the answers, it is worth prioritizing even if the estimated volume is low.
A competitor is running ads in ChatGPT. Should I follow?
First confirm three things: which country the ads appear in, which questions they target, and whether the competitor keeps running them. Ads that keep appearing suggest the competitor sees a return, but you still need to decide with your own unit economics.
Can Dageno tell me the market size directly?
No. Dageno observes AI answers, citations, ads, and product cards to narrow your research scope and find competitive gaps. Market size and sales potential need independent business research and first-party data.
Conclusion
Busy AI answers are a lead worth following up, not a conclusion you can take straight to project approval. First identify which kind of activity it is, then look for evidence in this order: “AI can answer → buyers ask repeatedly → someone pays → demand reaches you.” That way, a nice-looking AI list won't lead your judgment astray.
To see the AI answers, competitors, citations, and ads in your own market, you can run a free lookup. It covers 12,000+ market segments.
Dageno is the research and insights team at Dageno AI, publishing industry reports and expert analysis on AI Search Visibility, Generative Engine Optimization (GEO), and AI-powered search discovery.