73,977 AI Answers Reveal: Google AI Shopping Category Analysis (Part 1)
An analysis of 73,977 AI answers reveals how brands, products, user intent, and retail channels compete for visibility in Google AI Shopping.
Track AI search visibilityNo install
Updated by
10 Min Read
Updated on Jul 23, 2026
1. AI Shopping Is Rewriting Product Discovery
Traditional search usually begins with keywords, leaving users to filter options across multiple pages. AI Shopping starts with a natural-language question. It first interprets the user’s real constraints, performs query fan-out to expand and break down the request, retrieves multiple subtopics and data sources, and then generates a shortlist, recommendation rationale, and purchasable products. Google’s official description of AI Mode also references query fan-out and the combination of Gemini capabilities with the Shopping Graph for purchase decisions.
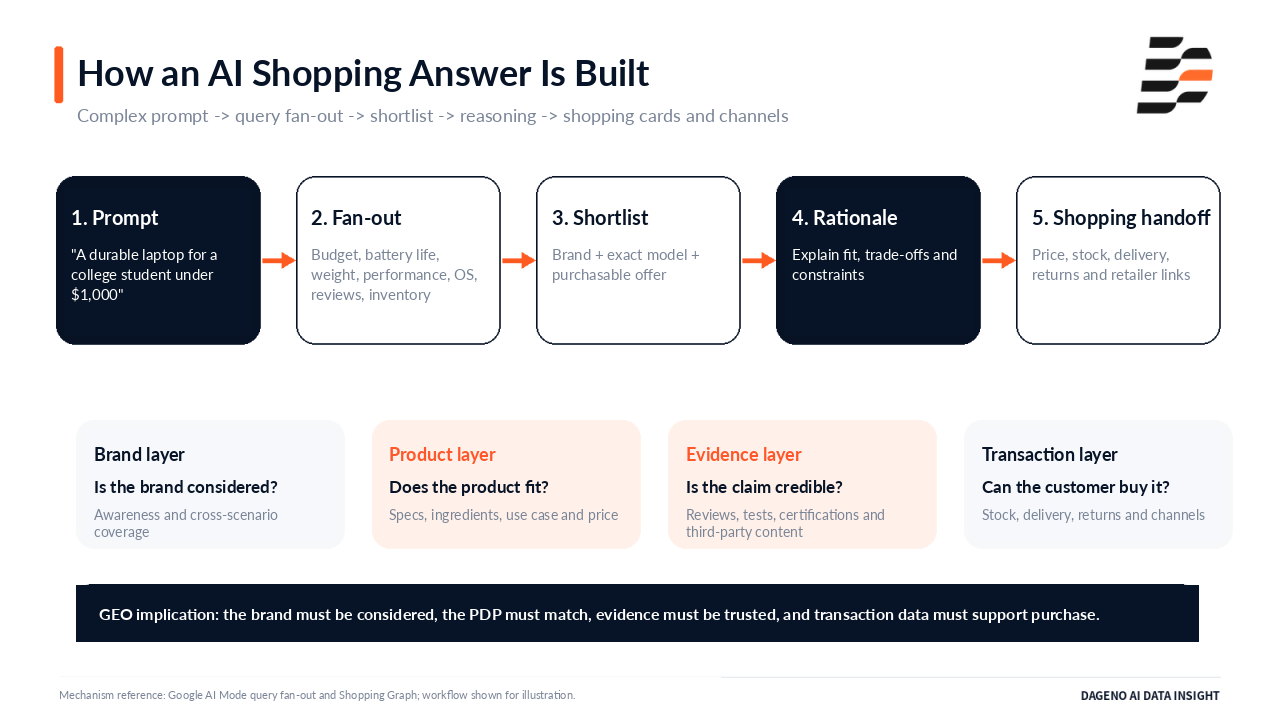
Figure 1 | A Typical AI Shopping Answer Flow.
2. Category Landscape: The 10 Most Competitive Brand Arenas
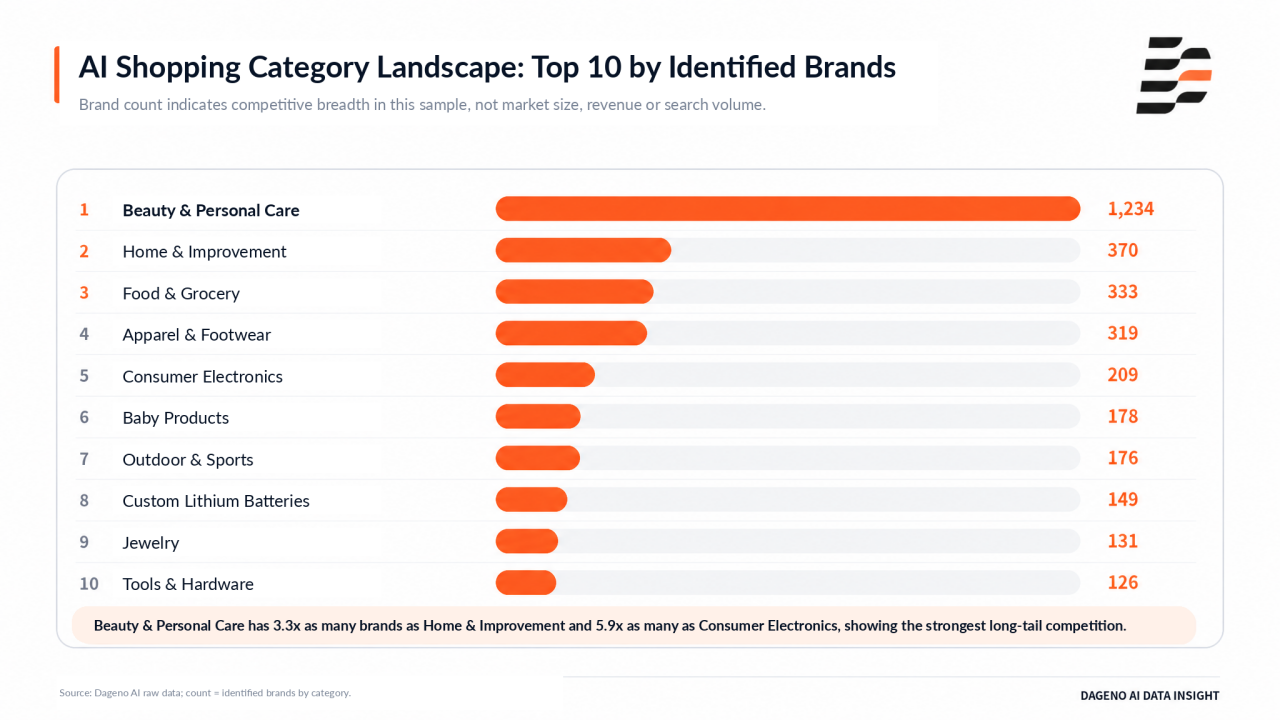
Figure 2 | Top 10 Categories by Identified Brand Count.
Dageno AI analyzed 73,977 AI answers collected through 2026 H1, referred to below as the source dataset. The analysis identified 4,555 brands across 32 categories. Among the Top 10 categories by identified brand count, Beauty & Personal Care ranked first with 1,234 brands, far ahead of Home & Improvement (370), Food & Grocery (333), and Apparel & Footwear (319). This indicates that Beauty & Personal Care had the broadest brand coverage in the sample and stronger participation from long-tail brands. Consumer Electronics, Baby Products, Outdoor & Sports, Custom Lithium Batteries, Jewelry, and Tools & Hardware had comparatively fewer identified brands.
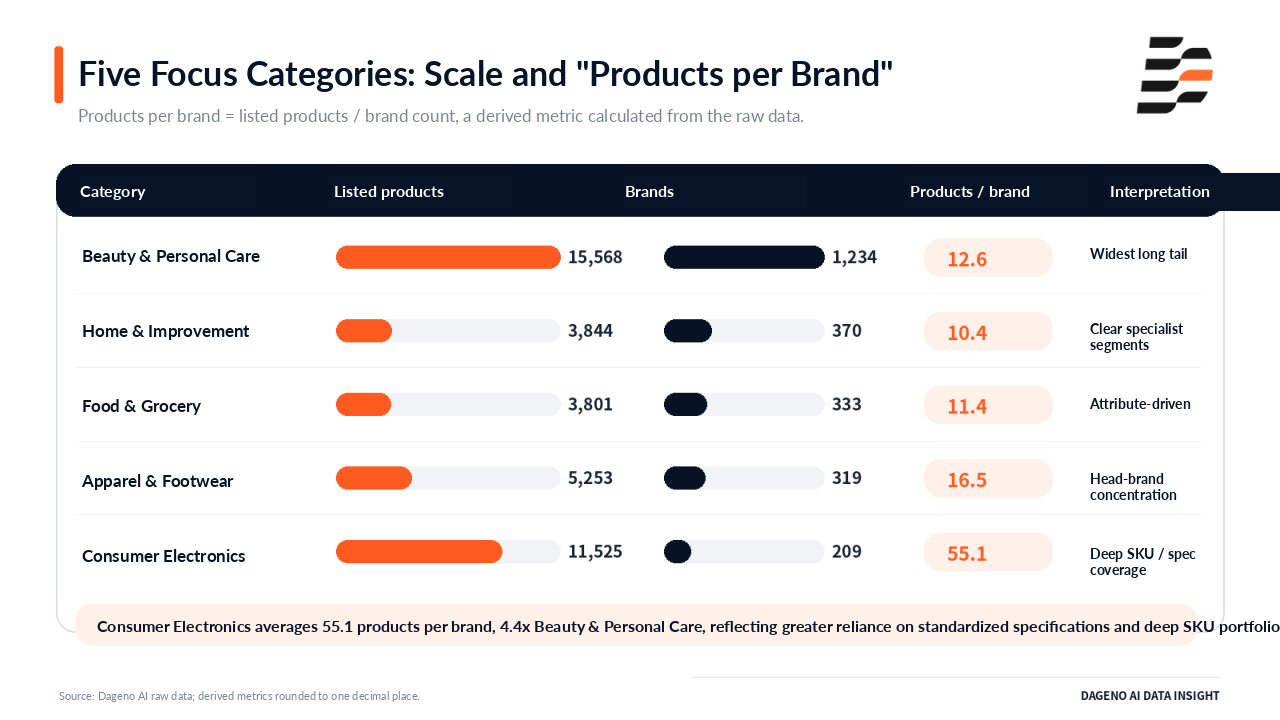
Figure 3 | Listed Products, Brand Count, and Products per Brand in Five Focus Categories.
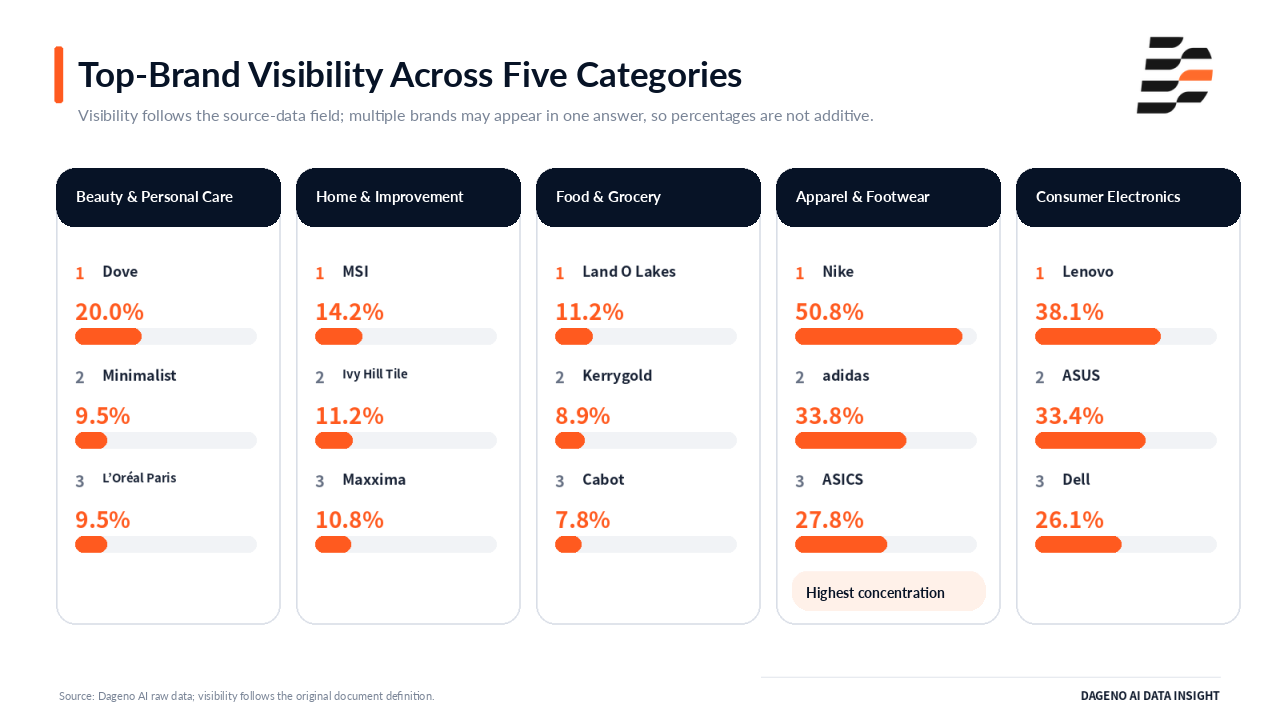
Figure 4 | Top-Brand Visibility Across Five Categories.
3. What Users Ask and How AI Responds
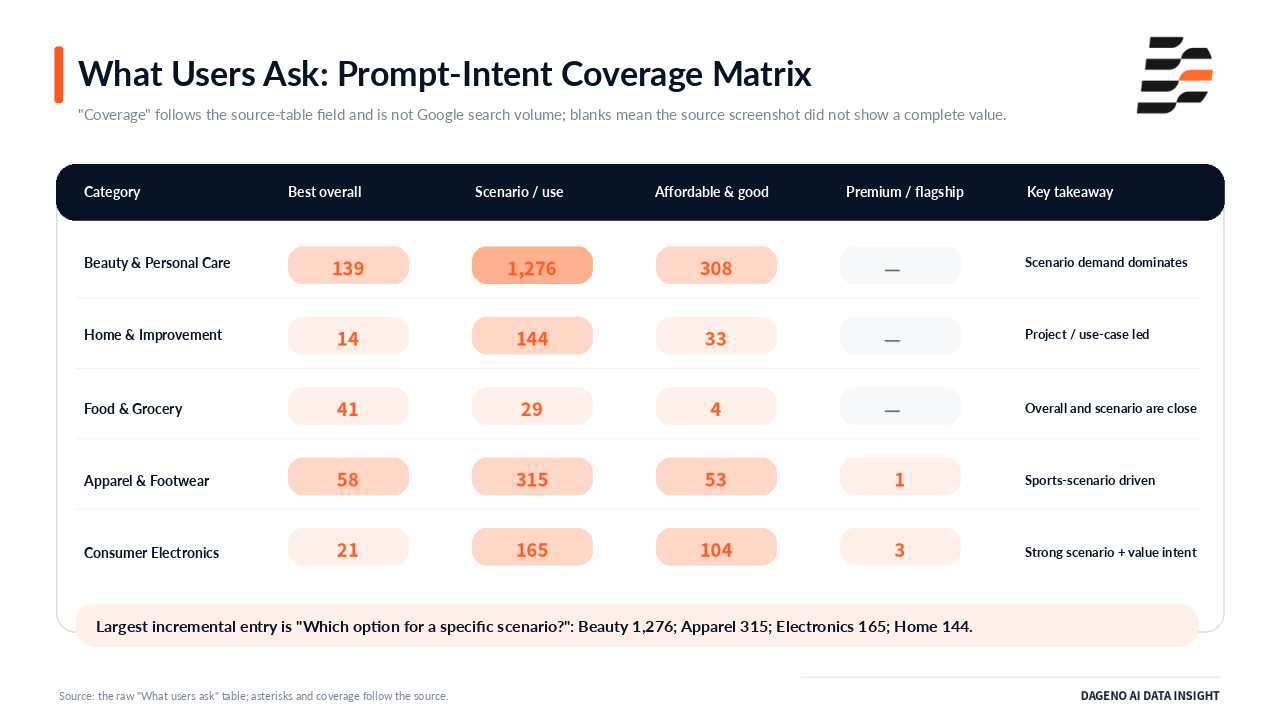
Figure 5 | Prompt-Intent Coverage Matrix for Five Categories.
Scenario-based questions are the clearest incremental entry point. Coverage for “which option should I choose for a specific scenario or use case?” reached 1,276 in Beauty & Personal Care, 315 in Apparel & Footwear, 165 in Consumer Electronics, and 144 in Home & Improvement. Food & Grocery is the exception in the current sample: overall-choice coverage was 41, higher than scenario coverage at 29, so patterns from the other categories should not be applied mechanically.
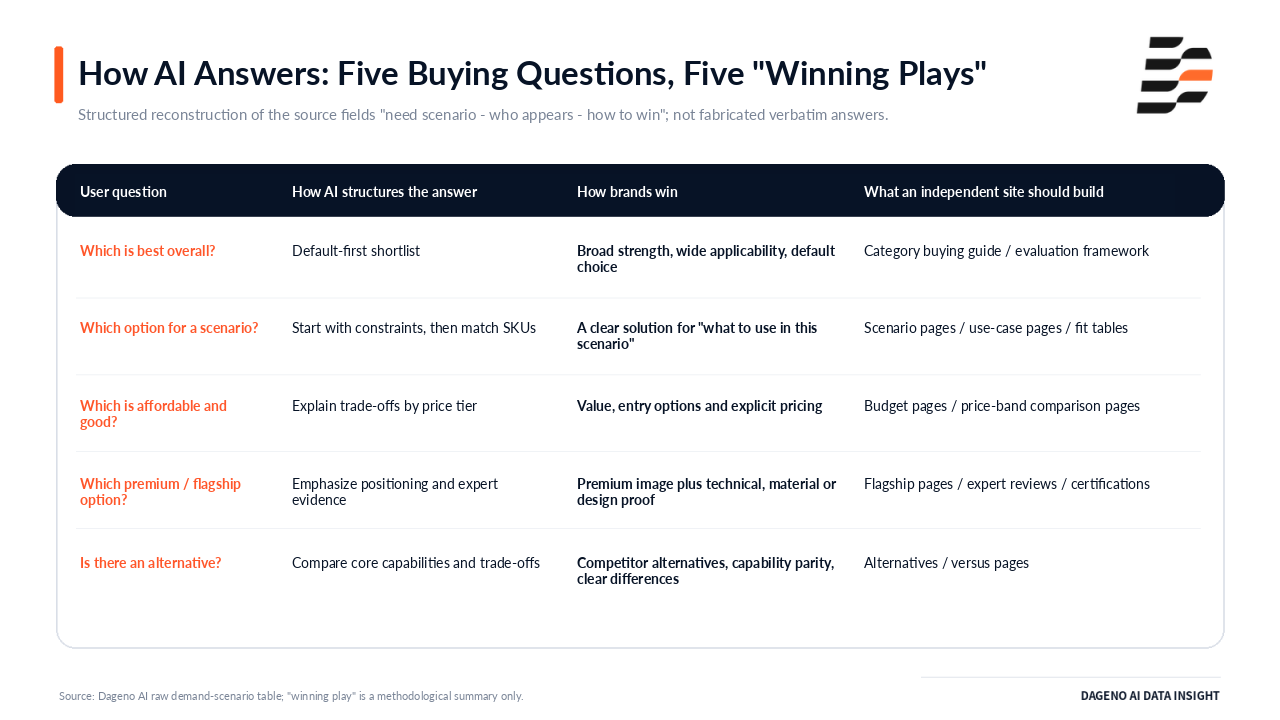
Figure 6 | Five Buying Questions and How AI Structures Its Answers.
| Category | Overall: high-frequency brands (coverage) | Scenario/use: high-frequency brands (coverage) | Affordable: high-frequency brands (coverage) | Premium / flagship |
|---|---|---|---|---|
| Beauty & Personal Care | OUAI, CeraVe, L’Oréal Paris(139) | Dove, L’Oréal Paris, Pilgrim(1,276) | Plum, Minimalist, Dove(308) | / |
| Home & Improvement | Maxxima, Philips Hue, Feit Electric(14) | MSI, Maxxima, Lithonia Lighting(144) | IKEA, Merola Tile, Havana(33) | / |
| Food & Grocery | Kerrygold, Land O Lakes, Tillamook(41) | VitaCup, Laird Superfood, Heinz(29) | Wellesley Farms, Uni-Eagle, Stumptown Coffee Roasters(4) | / |
| Apparel & Footwear | Nike, ASICS, adidas(58) | Nike, adidas, ASICS(315) | Nike, adidas, ASICS(53) | Veja, Tory Burch, Burberry(1) |
| Consumer Electronics | Sony, ASUS, Fujifilm(21) | Lenovo, ASUS, Dell(165) | Lenovo, Acer, ASUS(104) | Samsung, Motorola, Google(3) |
4. Deep Dive into Five Focus Categories: Scale, Brands, SKUs, Selling Points, Prompts, and Channels
4.1 Beauty & Personal Care: The Most Fragmented Competition, Centered on Ingredients x Audience x Benefits
Beauty has the largest brand pool, but scenario-prompt coverage is far higher than overall recommendations. The opportunity is not to compete for a broad category term, but to own combinations of “who + what problem + which ingredient or benefit.”
| Scale | Top-brand visibility | Leading products |
|---|---|---|
| 15,568 listed products; 1,234 brands; 12.6 products per brand | Dove 20%; Minimalist 9.5%; L’Oréal Paris 9.5%; Pilgrim 8.9%; OUAI 7.4%; CeraVe 7.2% | Salt & Stone Deodorant (76 mentions, 4.0%); The Ordinary Natural Moisturizing Factors + HA (48 mentions, 2.5%); Amika Frizz-Me-Not Treatment (47 mentions, 2.5%); Degree Men’s Antiperspirant (45 mentions, 2.4%) |
Subcategory Positioning
| Product subcategory | AI-recommended leading brands | Queries / coverage | Competing brands or characteristics |
|---|---|---|---|
| Hair care / shampoo | Dove, L’Oréal Paris, Bare Anatomy | 352 | 390 brands |
| Skin care | Minimalist, Pilgrim, Plum | 321 | 389 brands |
| Facial cleansing | Dot & Key, Minimalist, Cetaphil | 57 | 92 brands |
| Sun protection | Biotique, Hyphen, Deconstruct | 64 | 94 brands |
Brand x Selling Point: What AI Praises
| Attribute / selling point | No. 1 brand | Other high-frequency brands | Interpretation |
|---|---|---|---|
| Moisturizing | CeraVe(60) | Dot & Key(51), L’Oréal Paris(39), Amika(37), Moroccanoil(29) | Clear benefit attributes can help a brand lead within a specific need. |
| Men | Dove(33) | L’Oréal Paris(11), Kérastase(8) | Audience labels create a distinct candidate set. |
| Shampoo | L’Oréal Paris(46) | Dove(21), Redken(20), Pilgrim(18), CeraVe(16) | Overall brand rankings differ from subcategory attribute rankings. |
What Users Ask and How AI Structures the Answer
| Prompt intent | High-frequency brands | How to win in AI | Coverage |
|---|---|---|---|
| Which is best overall? | OUAI, CeraVe, L’Oréal Paris | Strengthen overall capabilities and compete to become AI’s default choice. | 139 |
| Specific scenario / use case | Dove, L’Oréal Paris, Pilgrim | Cover specific user scenarios and build content around “solutions for a defined need.” | 1,276 |
| Affordable and good | Plum, Minimalist, Dove | Emphasize affordability, value for money, and entry-level options. | 308 |
| Premium / flagship | Oribe and Moroccanoil | Establish premium positioning and professional evidence. | / |
Shopping-Card Channels
Walmart 2,544; eBay 2,341; Target 1,877; Ulta Beauty 1,756; Amazon 1,611; Macy’s 1,087; Sephora 1,033; Walgreens 474; GoSupps Beauty 445; Nordstrom 399. General marketplaces and vertical beauty retailers coexist.
Independent-site / GEO actions
- Create an attribute table for every SKU covering ingredients, benefits, skin or hair type, fragrance, excluded ingredients, specifications, usage, and limitations. Keep the PDP, JSON-LD, and feed consistent.
- Prioritize scenario pages for sensitive skin, dry skin, oily skin, color-treated hair, sulfate-free, fragrance-free, and budget ranges instead of writing only broad pages such as “best skin-care brands.”
- Reviews and tests must correspond to specific benefits and audiences. Do not add fabricated AggregateRating markup or benefit claims without real data.
4.2 Home & Improvement: Specialist Retailers Lead, and Installation Details and Specifications Become Recommendation Evidence
AI decision-making in home improvement resembles engineering selection. Users do not simply ask “which is best”; they ask what to choose for a particular room, project, size, or installation condition.
| Scale | Top-brand visibility | Leading products |
|---|---|---|
| 3,844 listed products; 370 brands; 10.4 products per brand | MSI 14.2%; Ivy Hill Tile 11.2%; Maxxima 10.8%; Merola Tile 9.5%; IKEA 9.1%; Daltile 8.6% | Commercial Electric 5/6 in Integrated LED Recessed Retrofit Light Trim (19 mentions, 8.2%); Personal Creations Personalized Diploma Tassel Frame (14 mentions, 6.0%) |
Subcategory Positioning
| Product subcategory | AI-recommended leading brands | Queries / coverage | Competing brands or characteristics |
|---|---|---|---|
| Tile | MSI, Ivy Hill Tile, Merola Tile | 24 | 58 brands |
| Outdoor furniture | Gardeon, Livsip, IKEA | 12 | 21 brands |
| Bedroom furniture | Havana, Silverwood, Wentworth | 12 | 11 brands |
| Commercial lighting | RAB, Maxxima, Sunco | 4 | 24 brands |
Brand x Selling Point: What AI Praises
| Attribute / selling point | No. 1 brand | Other high-frequency brands | Interpretation |
|---|---|---|---|
| LED | Lithonia Lighting(18) | Maxxima(16), IKEA(4), Feit Electric(4), Sunco(4) | Technical attributes are tightly linked to product type. |
| Polished | MSI(11) | Ivy Hill Tile(11), Apollo Tile(4), Bedrosians(4), Daltile(2) | Surface finish becomes a key comparison dimension for tile. |
| Matte | Bedrosians(11) | Stainmaster(11), MSI(10), Apollo Tile(5) | Attributes can reorder brands within the same category. |
What Users Ask and How AI Structures the Answer
| Prompt intent | High-frequency brands | How to win in AI | Coverage |
|---|---|---|---|
| Which is best overall? | Maxxima, Philips Hue, Feit Electric | Strengthen overall capabilities and compete to become the default choice. | 14 |
| Specific scenario / use case | MSI, Maxxima, Lithonia Lighting | Build solutions around rooms, projects, and installation scenarios. | 144 |
| Affordable and good | IKEA, Merola Tile, Havana | Emphasize value, entry-level options, and price advantages. | 33 |
| Alternative / substitute | / | Build competitor-alternative and capability-comparison content. | / |
Shopping-Card Channels
Home Depot 660; Lowe’s 295; Wayfair 294; Amazon 277; Walmart 216; eBay 166; Target 91; Blindster 53; Best Buy 44; IKEA 44. Home Depot appeared about 2.2 times as often as second-ranked Lowe’s.
Independent-site / GEO actions
- State exact dimensions, materials, surface finishes, installation methods, suitable spaces, compatible accessories, certifications, and warranties on product pages. Critical specifications must not be hidden only in images.
- Build pages around project scenarios such as bathroom renovation, commercial lighting, and outdoor patio, with measurement, installation, and compatibility guides.
- Specialist retailers often provide more complete product information. Independent sites need equally reliable inventory, delivery, returns, and technical documentation to reduce AI uncertainty.
4.3 Food & Grocery: Attributes Are Tied to Consumption Scenarios, and Delivery Availability Enters the Recommendation Logic
Brand advantage in Food & Grocery depends heavily on specific attributes and purchase contexts. In the source sample, overall recommendations were not completely overtaken by scenario-based prompts. This means brands should first examine the category’s prompt structure before deciding where to invest in content.
| Scale | Top-brand visibility | Leading products |
|---|---|---|
| 3,801 listed products; 333 brands; 11.4 products per brand | Land O Lakes 11.2%; Kerrygold 8.9%; Cabot 7.8%; Tillamook 6.1%; Knorr 6.1% | Duke’s Real Mayonnaise (27 mentions, 15.1%); Hellmann’s Real Mayonnaise (24 mentions, 13.4%); Primal Kitchen Mayo Avocado Oil (17 mentions, 9.5%); Belmont Virginia Peanuts Sampler (14 mentions, 7.8%) |
Subcategory Positioning
| Product subcategory | AI-recommended leading brands | Queries / coverage | Competing brands or characteristics |
|---|---|---|---|
| Dairy products | Kerrygold, Cabot, Land O Lakes | 13 | 31 brands |
| Coffee beans | Pachamama, Primos Coffee Co, Equal Exchange | 13 | 18 brands |
| Candy | Dylan’s Candy Bar, Sugarfina, Smarties | 7 | 35 brands |
| Seasonings | Knorr and others | 8 | 32 brands |
Brand x Selling Point: What AI Praises
| Attribute / selling point | No. 1 brand | Other high-frequency brands | Interpretation |
|---|---|---|---|
| Unsalted | Land O Lakes(11) | Tillamook(10), Kerrygold(8), Vital Farms(7), Plugra(5), Cabot(2) | Clear dietary and cooking attributes can reorder candidates. |
| Salted | Land O Lakes(12) | Kerrygold(7), Vital Farms(2) | One brand can occupy several adjacent attribute positions. |
| Natural | Kerrygold(14) | Tillamook(3) | Attribute claims need ingredient and factual support. |
| Low sodium | Knorr(15) | The source table lists no other high-frequency brands. | Functional dietary constraints create a distinct recommendation slot. |
What Users Ask and How AI Structures the Answer
| Prompt intent | High-frequency brands | How to win in AI | Coverage |
|---|---|---|---|
| Which is best overall? | Kerrygold, Land O Lakes, Tillamook | Strengthen overall capabilities and default-choice positioning. | 41 |
| Specific scenario / use case | VitaCup, Laird Superfood, Heinz | Build shopping-guide content around “what to use in this scenario.” | 29 |
| Affordable and good | Wellesley Farms, Uni-Eagle, Stumptown Coffee Roasters | Offer value and entry-level products with explicit pricing. | 4 |
| Premium / flagship | Some brands are visible in the source screenshot. | Emphasize quality, origin, and professional evidence. | / |
Shopping-Card Channels
Walmart 641; Instacart 281; Target 262; eBay 254; Hy 178; Amazon 112; Desertcart.ae 77; GoSupps 75; WebstaurantStore 74; Hannaford 63. Walmart supports large-scale purchasing, while Instacart reflects immediate delivery.
Independent-site / GEO actions
- Structure ingredients, nutrition facts, allergens, dietary labels, salt, sugar and fat content, net quantity, pack count, storage method, and origin.
- Build content around real use cases such as unsalted butter for baking, low-sodium seasonings, coffee beans for the office, family packs, and single-person packs.
- Prices, inventory, delivery areas, cold-chain requirements, and return restrictions must be kept current. Incorrect food information directly damages credibility.
4.4 Apparel & Footwear: Leading Sports Brands Are Concentrated, but Scenario and Fit Still Determine the Specific SKU
Apparel & Footwear has the highest top-brand concentration among the five categories, yet coverage for “specific scenario or use case” is still 5.4 times that of overall recommendations. Brand strength determines entry into the candidate set, while scenario fit determines the specific SKU.
| Scale | Top-brand visibility | Leading products |
|---|---|---|
| 5,253 listed products; 319 brands; 16.5 products per brand | Nike 50.8%; adidas 33.8%; ASICS 27.8%; Under Armour 15.9%; Brooks 15.5%; Puma 14.8% | Nike Men’s Giannis Immortality 4 Basketball Shoes (48 mentions, 10.6%); Under Armour Men’s Tech 2.0 Shirt (37 mentions, 8.2%); ASICS Novablast 5 (35 mentions, 7.7%) |
Subcategory Positioning
| Product subcategory | AI-recommended leading brands | Queries / coverage | Competing brands or characteristics |
|---|---|---|---|
| Athletic shoes | Nike, ASICS, adidas | 70 | 78 brands |
| Basketball shoes | Nike, adidas, Under Armour | 44 | 33 brands |
| Running shoes | ASICS, Brooks, Nike | 36 | 29 brands |
| Hiking shoes | Merrell, Salomon, Columbia | 19 | 28 brands |
| Trail-running shoes | Salomon, Brooks, Merrell | 15 | 19 brands |
Brand x Selling Point: What AI Praises
| Attribute / selling point | No. 1 brand | Other high-frequency brands | Interpretation |
|---|---|---|---|
| Men’s | Nike(343) | adidas(125), ASICS(89), Under Armour(43), Brooks(36) | Leading brands gain scale advantages in audience-specific slots. |
| Women’s | Nike(195) | Columbia(19), ASICS(18), Merrell(18), Brooks(15), Hoka(14) | The second tier is more fragmented in women’s scenarios. |
| Waterproof | Columbia(46) | Merrell(18), KEEN(18), Salomon(12) | Functional attributes can allow a brand that is not No. 1 overall to lead. |
What Users Ask and How AI Structures the Answer
| Prompt intent | High-frequency brands | How to win in AI | Coverage |
|---|---|---|---|
| Which is best overall? | Nike, ASICS, adidas | Strengthen overall capabilities and compete to become the default choice. | 58 |
| Specific scenario / use case | Nike, adidas, ASICS | Build buying guides around sport type, weather, and terrain. | 315 |
| Affordable and good | Nike, adidas, ASICS | Value, entry-level options, and explicit pricing. | 53 |
| Premium / flagship | Veja, Tory Burch, Burberry | Build a premium flagship image supported by professional evidence. | 1 |
Shopping-Card Channels
DICK’S Sporting Goods 516; eBay 448; Walmart 281; Zappos 276; Poshmark 252; Macy’s 250; Nordstrom 205; Amazon 204; Editorialist 199; DSW 172. Specialist sports retailers, department stores, resale platforms, and general marketplaces all appear.
Independent-site / GEO actions
- Specify sport type, terrain, weather, waterproofing, cushioning or support, last shape, sizing guidance, weight, materials, color, and model year on every SKU page.
- Build scenario and comparison pages such as “waterproof trail shoes for wide feet” and “ASICS vs Brooks for overpronation,” with conclusions supported by specifications and real testing.
- Keep multi-angle images, color variants, and size inventory synchronized. Visual content improves understanding but cannot replace specifications and fit conditions.
4.5 Consumer Electronics: Established Brands and Standardized Specifications Drive Recommendations
Consumer Electronics has relatively fewer brands, but each brand covers more listed products on average, reflecting the broader model portfolios and specification combinations of leading brands.
| Scale | Top-brand visibility | Leading products |
|---|---|---|
| 11,525 listed products; 209 brands; 55.1 products per brand | Lenovo 38.1%; ASUS 33.4%; Dell 26.1%; Acer 24.3%; Samsung 22.6%; Apple 22% | Lenovo IdeaPad Slim 3 (43 mentions, 12.6%); Samsung Galaxy A56 5G (41 mentions, 12.0%); Lenovo FHD IdeaPad Slim 3 Chromebook (38 mentions, 11.1%); Google Pixel 9a (36 mentions, 10.6%); Samsung Galaxy Watch8 (36 mentions, 10.6%) |
Subcategory Positioning
| Product subcategory | AI-recommended leading brands | Queries / coverage | Competing brands or characteristics |
|---|---|---|---|
| Laptops | Lenovo, ASUS, Acer | — | Asian brands lead recommendations. |
| Smartphones | Samsung, Apple, Google | — | Three-way competition, with Samsung covering more broadly. |
| Tablets | Samsung, Apple | — | Highly concentrated market. |
| Audio | Bose, Sennheiser, JBL | — | Specialist audio brands have a clear advantage. |
| Displays | Samsung, ASUS | — | Sub-scenarios such as gaming have a clear impact. |
Brand x Selling Point: What AI Praises
| Attribute / selling point | No. 1 brand | Other high-frequency brands | Interpretation |
|---|---|---|---|
| FHD | Lenovo(44) | Dell(20), ASUS(19), MSI(11), Samsung(3) | Display specifications create specific comparison slots. |
| Black | Apple(45) | Samsung(16), Sony(7), Microsoft(5), Dell(3) | Color and variants can also affect retrieval. |
| Intel Core | Acer(129) | ASUS(20), Dell(15), Lenovo(6) | Processor specifications can reorder brands. |
| Chromebook | Lenovo(151) | ASUS(12), Dell(4) | Operating system and product form create a highly concentrated candidate set. |
What Users Ask and How AI Structures the Answer
| Prompt intent | High-frequency brands | How to win in AI | Coverage |
|---|---|---|---|
| Which is best overall? | Sony, ASUS, Fujifilm | Strengthen overall capabilities and compete to become the default choice. | 21 |
| Specific scenario / use case | Lenovo, ASUS, Dell | Build purchase guidance around use cases and specification trade-offs. | 165 |
| Affordable and good | Lenovo, Acer, ASUS | Offer value and entry-level products with explicit pricing. | 104 |
| Premium / flagship | Samsung, Motorola, Google | Establish flagship positioning and professional evidence. | 3 |
Shopping-Card Channels
Best Buy 1,985; eBay 1,843; Walmart 1,480; Amazon 1,400; Target 674; Newegg 512; Techinn 341; Micro Center 339; B&H Photo 320; Staples 292. Standardized retail channels are highly concentrated.
Independent-site / GEO actions
- Create machine-comparable specification tables covering processor, memory, storage, display, ports, networking, operating system, battery life, weight, warranty, compatibility, and package contents.
- Build pages around use cases and budgets such as college, gaming, creator, business, long battery life, and under $1,000, and explain the specification trade-offs.
- Model names, MPNs, GTINs, variants, and prices must remain consistent across the PDP, JSON-LD, Merchant Center, and third-party channels.
5. Where AI Sends Consumers: The Shopping-Channel Landscape
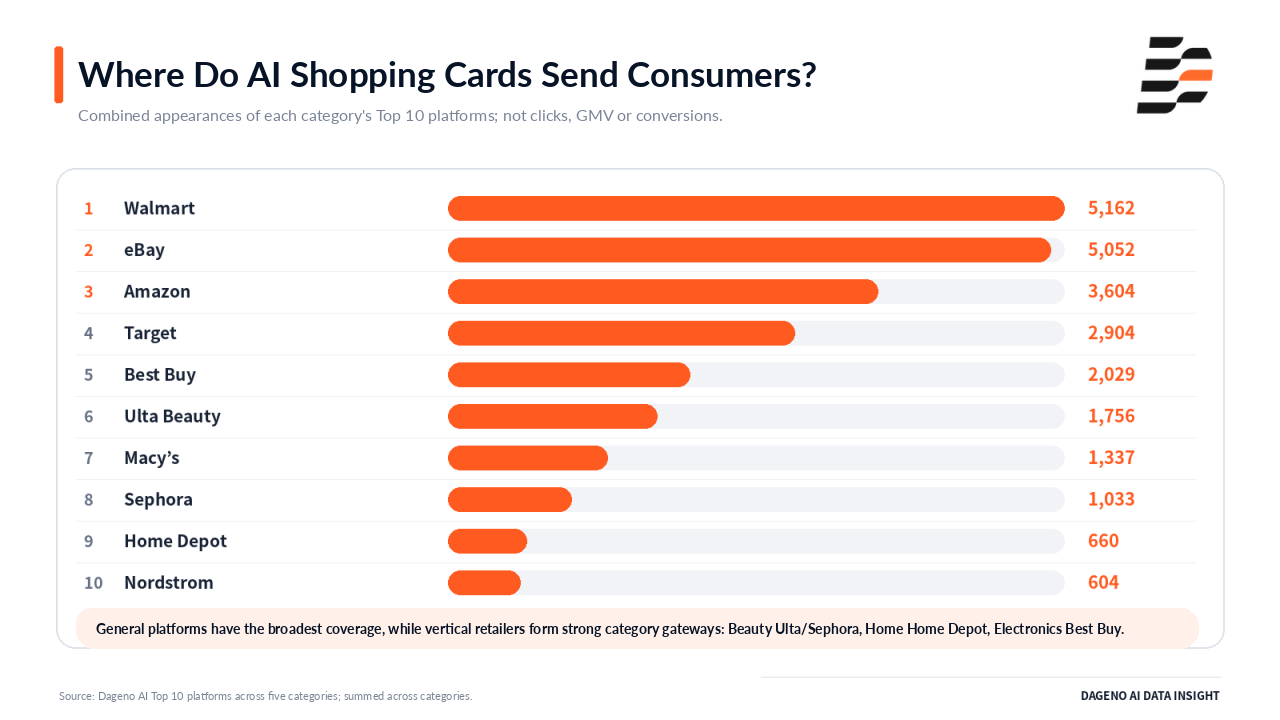
Figure 8 | Combined Appearances of the Top 10 Platforms Across Five Categories.
Walmart, eBay, Amazon, and Target had the broadest coverage in the combined statistics. However, category-specific retailers provide different forms of trust: Ulta Beauty and Sephora support expert beauty selection; Home Depot supports specification- and project-based home purchases; Best Buy and Newegg support standardized electronics comparisons; DICK’S and Zappos support sports and sizing needs; and Instacart supports immediate grocery delivery.
| Category | Primary channel structure | Implications for independent sites |
|---|---|---|
| Beauty & Personal Care | General marketplaces and vertical beauty retailers coexist. | Independent sites need ingredient and benefit explanations while matching retail platforms in transaction certainty. |
| Home & Improvement | Specialist channels such as Home Depot lead. | Technical specifications, installation, inventory, and delivery are core trust signals. |
| Food & Grocery | Walmart supports large-scale purchasing, while Instacart supports immediate-use scenarios. | Regional availability, specifications, shelf life, and delivery conditions must be clear. |
| Apparel & Footwear | Specialist sports retailers, department stores, resale platforms, and general marketplaces are highly fragmented. | Size, version, color, and inventory synchronization requirements are high. |
| Consumer Electronics | Best Buy, eBay, Walmart, Amazon, and similar platforms are concentrated. | Consistency across models, variants, specifications, and offers determines eligibility to compete. |
6. Conclusion: Understand Category Competition First, Then Turn GEO into a Sustainable Growth System
Dageno AI’s analysis of 73,977 AI answers, 4,555 brands, and 32 categories shows that the logic for entering AI recommendation results differs by category. Beauty & Personal Care relies more on benefits, ingredients, and target users. Home & Improvement places greater weight on materials, dimensions, and installation scenarios. Food & Grocery is driven by ingredients, taste, and delivery conditions. Apparel & Footwear revolves around sport type, function, and wearing scenarios. Consumer Electronics is shaped primarily by models, specifications, compatibility, and budget ranges. The first step in GEO is not to produce more content blindly, but to identify the category’s competitive structure, find high-value scenarios in real user questions, and then close gaps in product information, content evidence, and channel coverage.
For brands expanding globally, GEO cannot stop at “making AI aware of the brand.” Brands need to build product information that is retrievable, comparable, and verifiable within their category. Beauty brands must clarify benefits and target audiences. Home brands must complete specifications and installation conditions. Food brands must structure ingredient and dietary information. Apparel brands must cover specific sports and wearing scenarios. Electronics brands must keep models, specifications, compatibility, and pricing consistent. The truly effective path is:
Understand the category position -> identify what users are asking -> determine the real competitors -> analyze why AI recommends them -> complete product and content evidence -> continuously monitor whether optimization is working.
This is also the core problem addressed by the Dageno AI data platform. The platform does more than count how often a brand is mentioned by AI. It breaks down how an AI recommendation is formed across dimensions such as brand position, ranking changes, real competitors, how different AI systems perceive the brand, user prompts, listed products, subcategories, recommended selling points, strengths and weaknesses, and cited websites. After optimization is implemented, continuous monitoring shows whether brand visibility, product inclusion, and scenario coverage have changed.
Dageno AI therefore provides a closed-loop GEO decision system: discover the problem -> identify the cause -> define actions -> monitor continuously -> verify results.
About the Author

Updated by
Dageno
Related Articles
We Built an Intent Diagnostic Dashboard for the Content Problems GSC Can’t Reveal
Dageno • Jul 17, 2026
From GSC/GA4 to Optimization Tasks: How to Build a Content Growth Diagnostic System
Dageno • Jun 29, 2026
Introduction to Dageno AI Diagnostic Center (2) - Prompt Mining Panel & High-Heat Prompt Generation

Tim • Jun 10, 2026
Introduction to Dageno AI Diagnostic Center (1) - Translating complex AI signals into growth
Tim • May 19, 2026