AI visibility is not a fixed rank. The same prompt can produce different wording, sources, and brand recommendations across runs, locations, accounts, models, and search modes. That makes “accuracy” a measurement-design question, not a vendor percentage.
This guide compares five AI visibility platforms by the controls that make their metrics more trustworthy: prompt provenance, collection method, model and market context, repeated sampling, raw-answer access, citation-level evidence, and exportability.
For a broader operational comparison centered on mentions and recommendations, review these brand mention tracking tools.
Quick comparison: AI visibility metrics tools
Platform
Best fit
Strongest measurement signal
Due-diligence question
Profound
Enterprise and multi-market programs
Consumer-interface collection, daily runs, raw exports
How many repetitions are included?
Semrush
SEO teams needing discovery plus tracking
Documented datasets and prompt sources
Which dataset powers each metric?
HubSpot AEO
HubSpot customers
Daily tracked prompts tied to marketing workflows
What are the prompt and answer limits?
Dageno
Teams moving from measurement to optimization
Citations, competitors, gaps, and content workflow
What collection method applies to each engine?
Ahrefs Brand Radar
SEO analysts and market discovery
Large discovery index plus custom prompts
How are discovery and custom tracking separated?
No platform can establish a universal “94% accurate” score without defining a ground truth, prompt population, engine, time window, sampling process, and error calculation. Treat unsupported accuracy percentages as marketing claims, not comparable evidence.
What “accurate AI visibility” should mean
1. A representative prompt set
A dashboard is only as representative as the prompts behind it. A useful set includes brand, category, problem, comparison, alternative, use-case, and purchase-intent questions. It should also record whether prompts came from customer research, search demand, platform discovery, or your own benchmark.
2. Repeated observations
Generative answers are stochastic. A single run can be real but unrepresentative. Research on generative-search measurement shows why visibility should be treated as an estimate with uncertainty rather than a permanent rank. Repeated collection makes it possible to distinguish a persistent change from normal answer variation.
3. Explicit engine and market context
“ChatGPT visibility” is incomplete metadata. The result can depend on model, search mode, date, country, language, personalization, and interface. A credible platform should disclose or let you control the dimensions that materially affect the answer.
4. Inspectable evidence
Aggregated share of voice is useful for scanning, but teams also need the original answer, brand context, cited domain, cited URL, timestamp, and prompt. Raw evidence lets analysts audit classification errors and explain changes.
5. Transparent metric definitions
Visibility, mention rate, citation share, position, sentiment, and recommendation strength measure different things. A tool should document its numerator, denominator, weighting, treatment of failures, and aggregation window. Otherwise two charts with the same label may not be comparable.
6. Failure and refusal reporting
Blocked requests, timeouts, empty answers, refusals, and unavailable search modes should not silently disappear. Excluding failed observations can inflate results and make a small sample look more stable than it is.
1. Profound: strongest public detail on answer collection
Profound Answer Engine Insights provides unusually useful public detail about its measurement workflow. The company says it collects answers through consumer-facing experiences, runs tracking daily, supports custom and observed prompts, preserves citations, compares platforms, and offers raw CSV exports.
Why its metrics are easier to audit
Daily observations support trend analysis rather than one-off checks.
Answer- and citation-level data can be inspected beneath aggregate metrics.
Region and language controls support multi-market comparisons.
Raw exports let analytics teams reproduce or challenge dashboard conclusions.
What to verify
Ask how many times each prompt is run, how failed observations are counted, which exact engine modes are used, and whether historical methodology changes are annotated. Public transparency is valuable, but it does not remove the need to test your own prompt set.
2. Semrush: best-documented separation of AI datasets
Semrush AI Visibility documents that its AI features use different datasets for market discovery and custom tracking. Its knowledge base explains prompt sources, collection schedules, model coverage, and how a large prompt database differs from user-defined monitoring.
Why that distinction matters
A discovery database estimates what is visible across a market; a custom tracker measures a controlled set of prompts important to one brand. Combining the two without labels can create misleading trends. Semrush's documented separation helps analysts choose the right dataset for the decision.
What to verify
Confirm which dataset, country, device or mode, refresh schedule, and prompt source power every exported metric. Do not compare a broad discovery score directly with a small custom benchmark as if they were the same population.
3. HubSpot AEO: best for a defined daily workflow in HubSpot
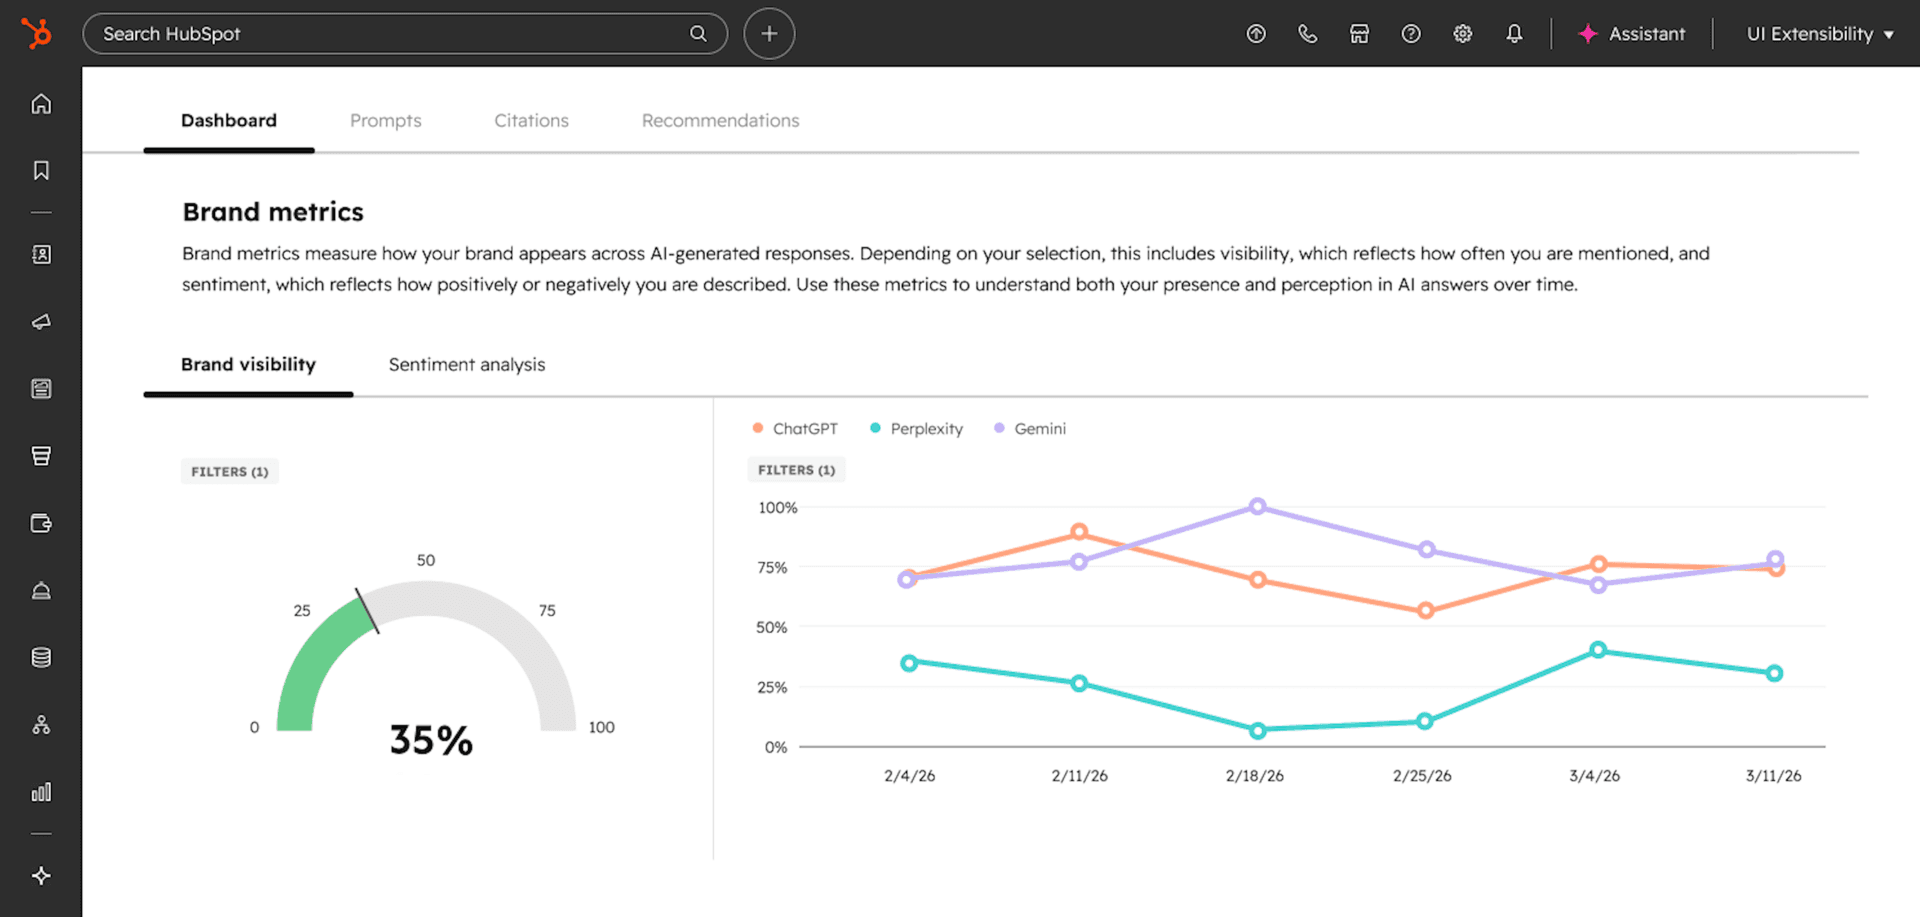
HubSpot AEO documents daily prompt tracking across ChatGPT, Gemini, and Perplexity, with brand visibility, competitor, citation, and recommendation views. The appeal is less about maximum engine count and more about connecting observations to an existing content and marketing workflow.
Why its metrics can be operationally reliable
A stable prompt list can be monitored every day.
Explicit account limits make sample size visible.
Citation and competitor views add context to the top-line visibility score.
Teams can connect findings to content they already manage in HubSpot.
What to verify
Check the limits that apply to your subscription, the exact answer count per prompt, market controls, raw-answer retention, and export options. A daily schedule is useful only when the underlying prompt set stays governed.
4. Dageno: best for turning evidence into optimization work
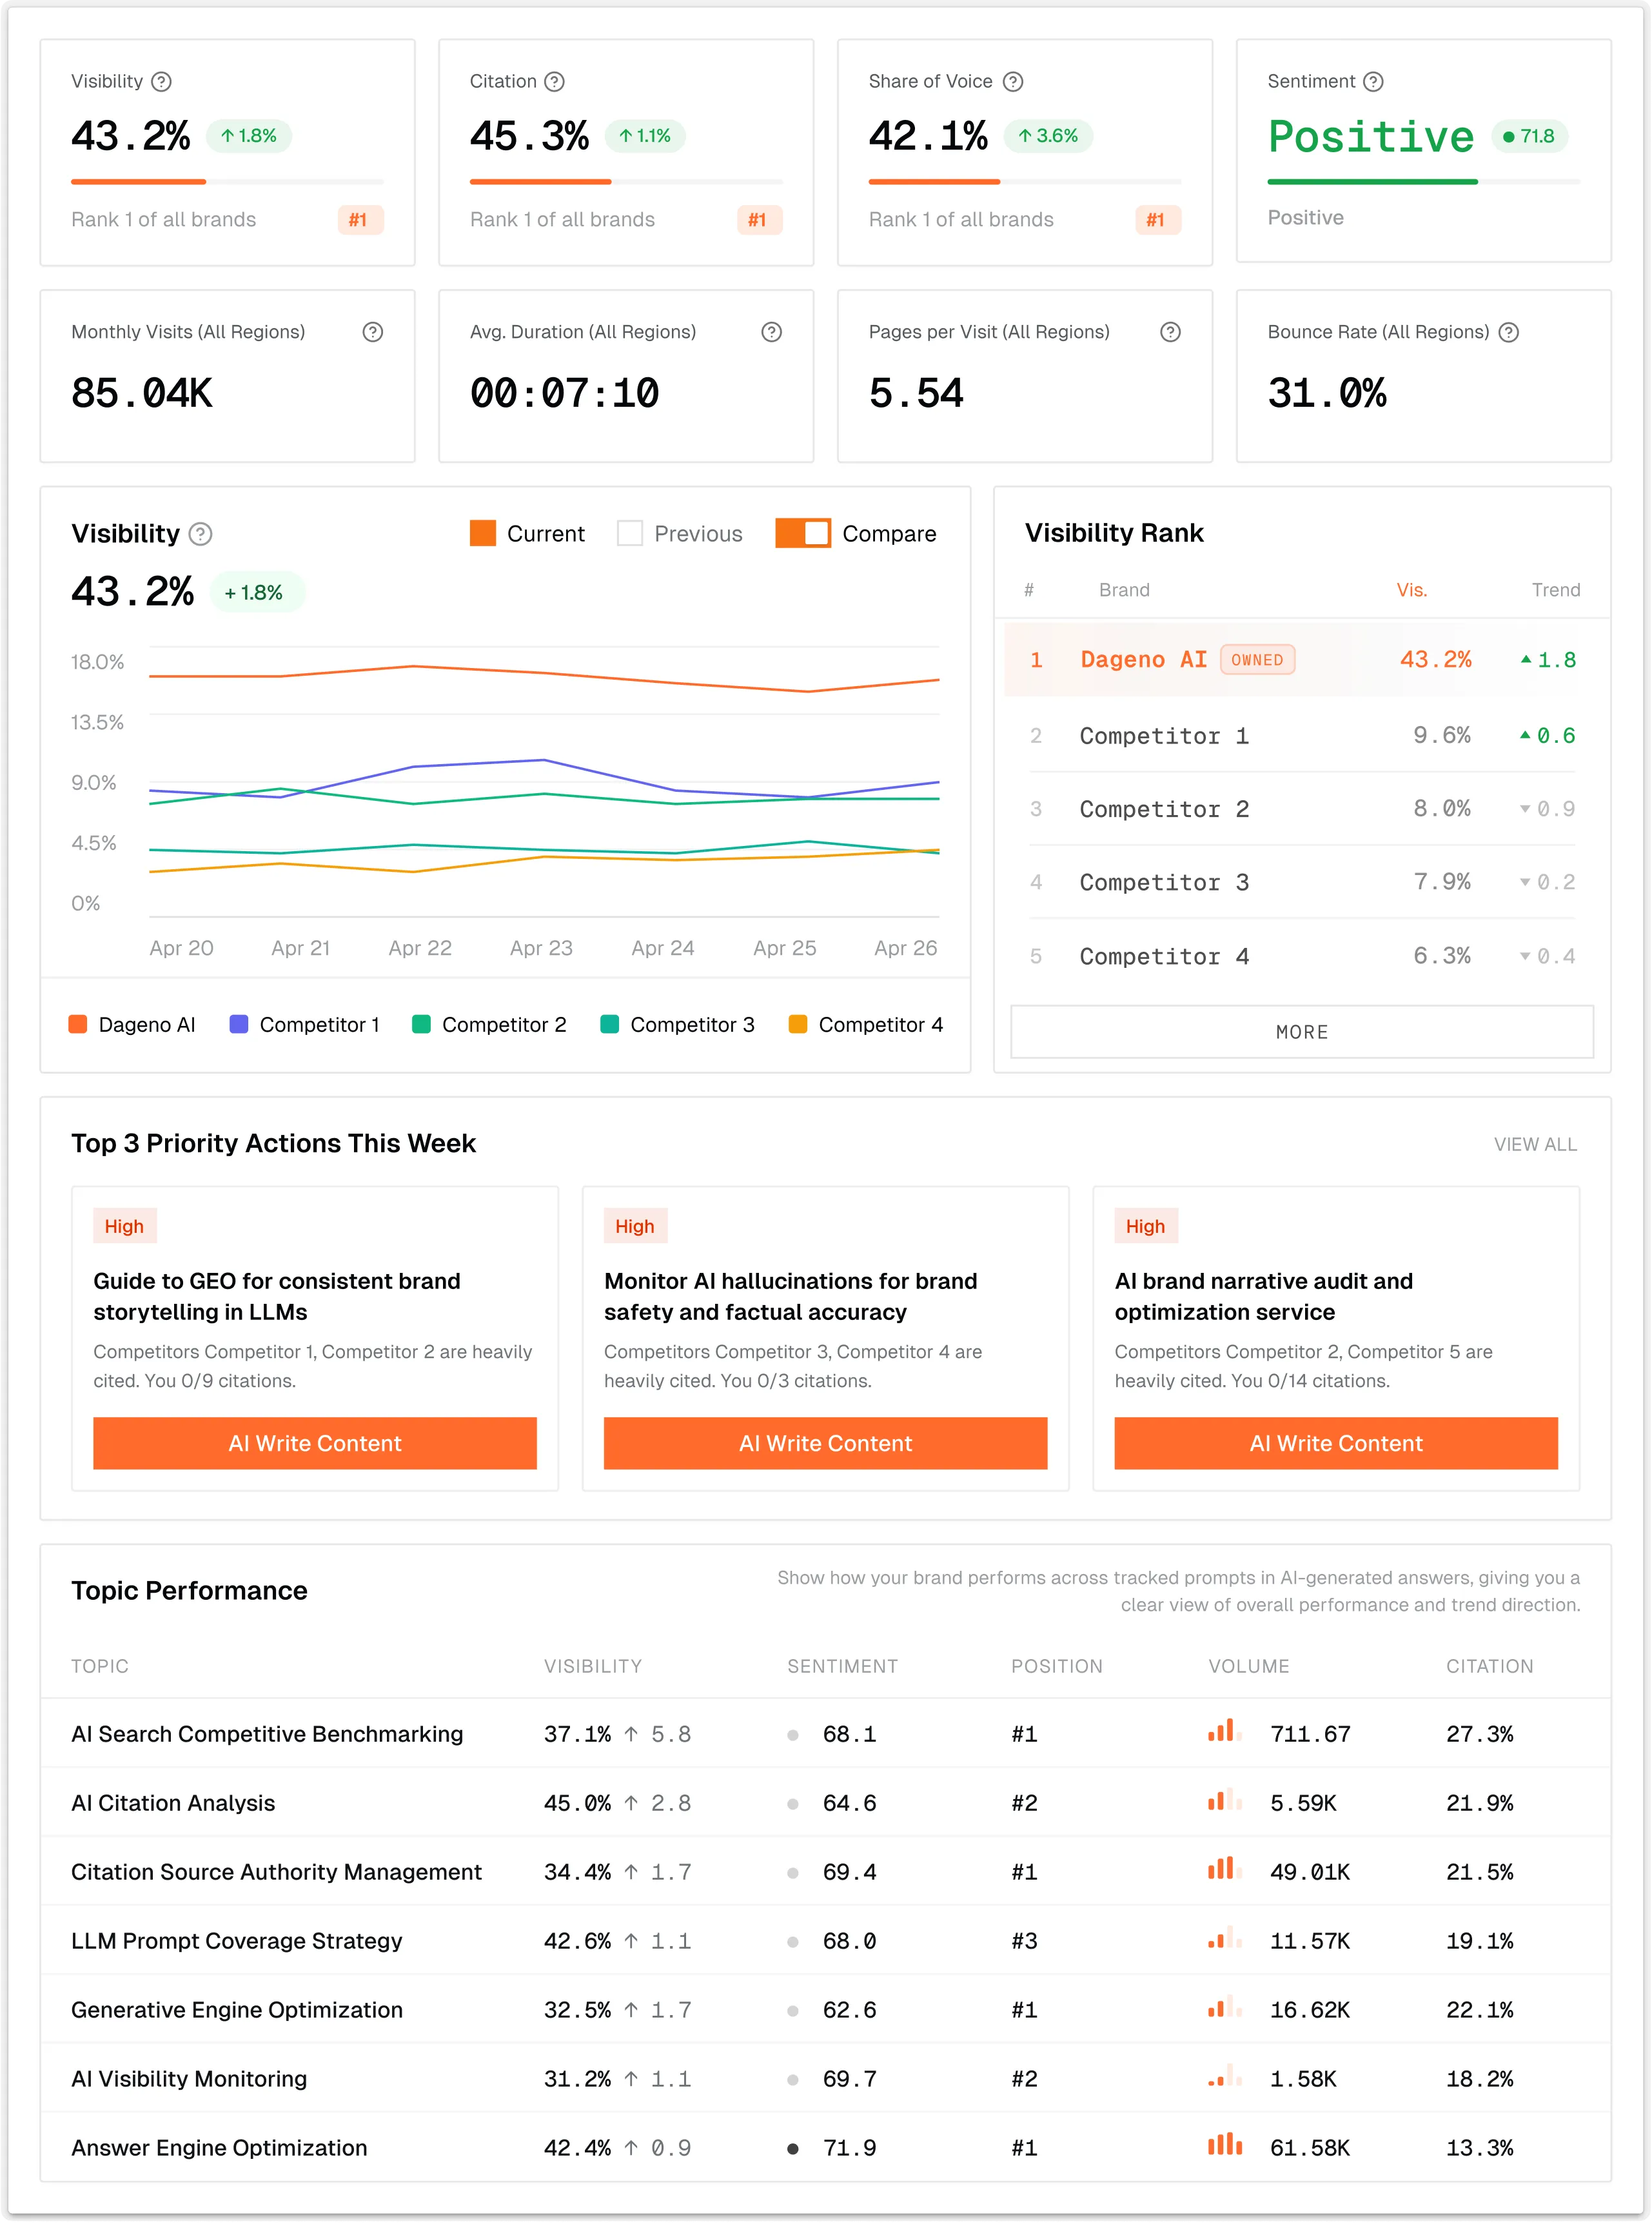
Dageno combines AI visibility tracking with citation analysis, competitor comparisons, topic gaps, and content optimization. That end-to-end flow matters because a statistically careful metric has limited business value if the team cannot trace it to a cited page or a concrete content change.
Measurement strengths
Prompt-level visibility and competitor comparison.
Citation and URL evidence for diagnosing changes.
Gap analysis that connects missing visibility to topics and sources.
Content workflows for acting on the findings.
What to verify
For each engine, confirm the collection interface, market and language controls, run frequency, repetition policy, failure handling, and raw-answer access. Dageno should be evaluated on this evidence and workflow fit, not on an unsupported universal accuracy percentage.
5. Ahrefs Brand Radar: best for discovery plus custom prompts
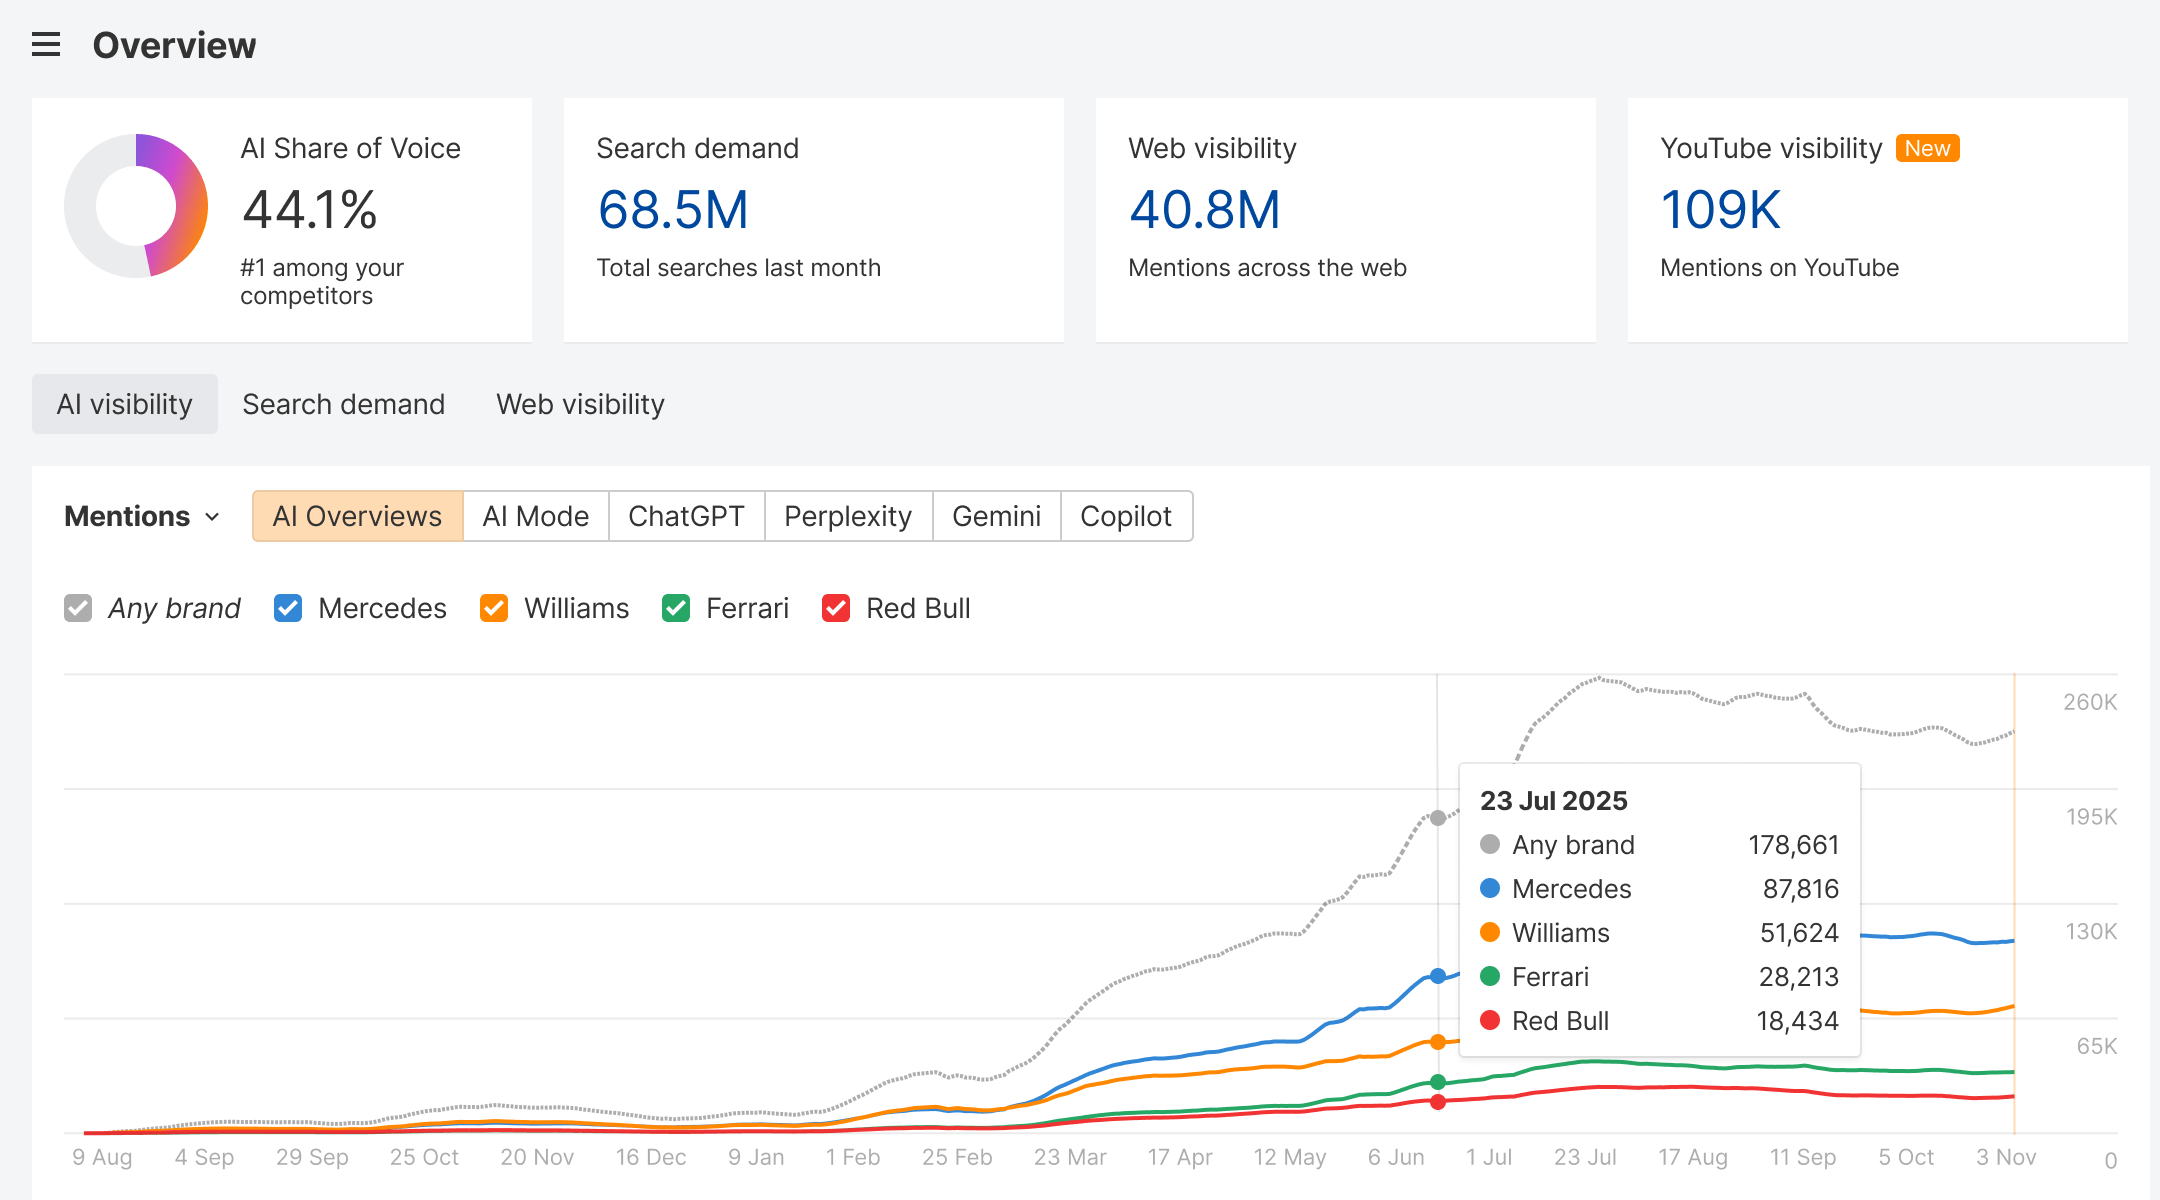
Ahrefs Brand Radar combines a large searchable AI-answer index with custom prompt tracking. This makes it useful for two distinct jobs: discovering how a market appears across a broad dataset and monitoring a curated benchmark over time.
Why its metrics are useful
Discovery data helps find brands, topics, mentions, and cited sources at scale.
Custom prompts create a controlled benchmark for priority questions.
Integration with Ahrefs data can connect AI citations to broader SEO analysis.
Source and URL views support content-level investigation.
What to verify
Keep discovery metrics and custom-prompt metrics separate in reporting. Confirm update cadence, market coverage, model or mode, repetition, and how answer failures affect the denominator.
A practical validation test before buying
Step 1: Build a fixed benchmark
Choose 30 to 100 prompts across brand, category, problem, comparison, alternative, and purchase intent. Record the target country and language. Freeze most of the set for at least four weeks.
Step 2: Run more than once
Collect repeated observations for a subset of high-value prompts. If a tool runs only once, manually repeat 10 to 20 prompts in the relevant consumer interface to estimate answer variability.
Step 3: Audit the raw evidence
Sample reported mentions, non-mentions, citations, sentiment labels, and competitor positions. Check whether the stored answer supports the classification and whether cited URLs resolve to the reported pages.
Step 4: Track failures separately
Count timeouts, refusals, blocked queries, empty answers, and mode mismatches. A tool that returns 80 valid observations from 100 attempts should not present the same certainty as one with 100 valid observations.
Step 5: Compare like with like
Use the same prompts, dates, markets, languages, and engines. Do not judge vendors solely by whose visibility number is higher; different definitions can produce different values from the same answers.
Metrics worth putting on an executive dashboard
Mention rate: valid answers that mention the brand divided by valid answers observed.
Citation rate: valid answers that cite a brand-owned URL divided by valid answers observed.
Share of voice: brand mentions relative to a defined competitor set, with weighting disclosed.
Citation share: citations to brand-owned pages relative to all citations or competitor citations.
Recommendation rate: answers that recommend the brand, separated from neutral mentions.
Prompt coverage: tracked prompt categories with enough valid observations.
Volatility or confidence: variation across repeated runs or an uncertainty interval.
Evidence completion: percentage of observations retaining answer text, citations, context, and timestamp.
Common measurement mistakes
Treating one response as a ranking
One answer is an observation, not a durable position. Use several runs and a rolling window before declaring a gain or loss.
Changing the prompt set without annotating the chart
Adding high-performing prompts can raise visibility even when the brand did not improve. Version the benchmark and separate same-set trends from expanded coverage.
Mixing markets and models
A global average can hide a sharp decline in one country or engine. Preserve market, language, platform, and mode dimensions until the final reporting layer.
Optimizing only the score
Visibility without citation context can reward shallow mentions. Pair the metric with recommendation context, cited URLs, source diversity, conversions, and qualified traffic where available.
To turn measurement findings into content and optimization work, compare answer engine optimization tools and the workflows they support.
Frequently asked questions
Which AI visibility software is the most accurate?
There is no independently established universal winner. Profound and Semrush publish useful methodology detail; HubSpot documents a defined daily workflow; Dageno connects evidence to optimization; and Ahrefs combines discovery with custom tracking. The most trustworthy choice is the one that passes a controlled test with your prompts and markets.
Can two accurate tools report different visibility scores?
Yes. They may use different prompts, engines, modes, regions, schedules, repetitions, denominators, and weighting. The disagreement is informative only when both methodologies are known.
How often should AI visibility be checked?
Daily or weekly collection can support trend detection, but reporting should use a multi-observation window. High-value prompts deserve repeated runs because generative answers can vary even when the underlying content has not changed.
Is a larger prompt database always more accurate?
No. A large database improves market discovery, while a smaller, representative benchmark can be better for tracking one brand. Coverage, provenance, and sampling design matter more than a headline prompt count.
Conclusion
The most accurate AI visibility software is not the tool with the most confident percentage. It is the platform that makes its prompt population, collection context, evidence, failures, metric definitions, and uncertainty inspectable. Test those controls first; then choose the workflow your team can consistently use to improve cited pages and brand recommendations.
Dageno is the research and insights team at Dageno AI, publishing industry reports and expert analysis on AI Search Visibility, Generative Engine Optimization (GEO), and AI-powered search discovery.